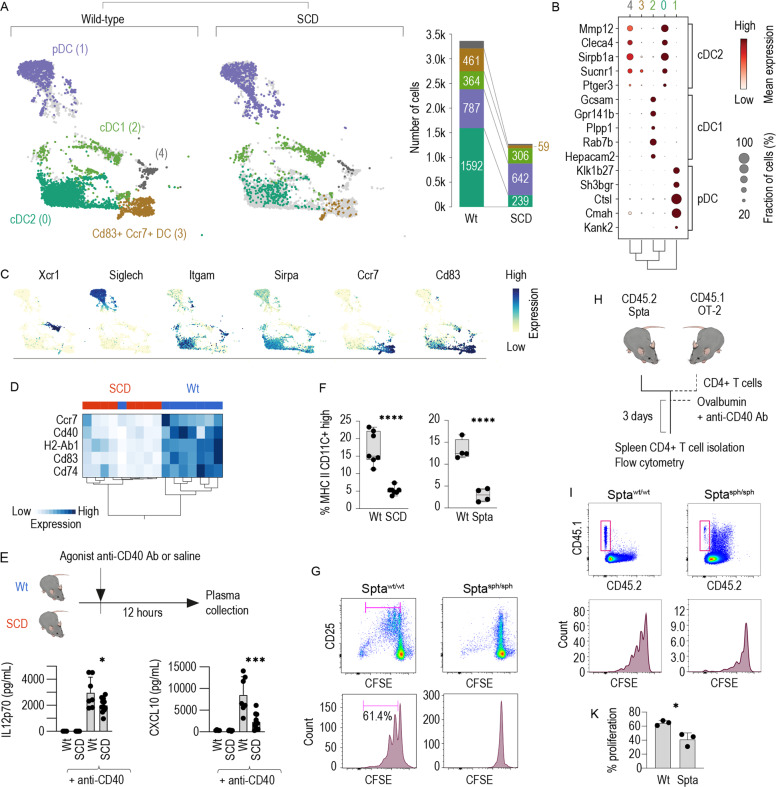
Fig. 6. Functional DC depletion in the SCD spleen is caused by a loss of cDC2s and Ccr7+ Cd83+ mature DCs.
A Left: All DCs from the scRNA-seq dataset in Fig. 5E/F were extracted and clustered using an unsupervised Leiden algorithm (numbers in parenthesis are cluster identities). For illustration of the differences, the dataset was separated by genotype (wild-type versus SCD). Right: The stack bar charts represent the number of cells per stratified for genotype. Numbers in parenthesis are cell counts. B Cell-type attribution. The dot plot shows the normalized expression intensity (color) and the fraction of positive cells (size) for the top five discriminating ImmGen marker genes for cDC1s, cDC2s, and pDCs in each cluster. The dot size indicates the fraction of cells, the code color the mean expression. The dendrogram shows the hierarchical clustering based on the PCA components between the five clusters. C UMAP intensity projections illustrate the expression of Xcr1, Siglech, Itgam, Sirpa, Ccr7, and Cd83 across the whole dataset of wild-type and SCD DCs. D Hierarchical clustering analysis of the normalized mRNA expression intensities for Cd74, H2-Ab1, Ccr7, Cd40, and Cd83 in isolated splenic DC suspensions. Isolated DC samples were collected from the spleen of eight SCD mice and eight wild-type mice using a DC isolation kit and analyzed by qRT-PCR. Each column indicates one mouse. The almost perfect clustering within genotypes and the long dendrogram distance suggest highly different expressions across the set of marker genes in wild-type versus SCD mice. E Plasma concentrations of CXCL10 and IL12p70 in SCD mice and wild-type littermates treated with saline (control) or an agonistic anti-CD40 antibody measured with a Bio-Plex assay. F Percentage of live CD45+ cells splenic CD11c+ MHC class IIhigh DCs in SCD mice, Sptasph/sph mice and their littermates measured by flow cytometry in DC enriched splenic cell suspension. G Enriched DC suspensions from the spleen of Sptasph/sph mice or wild-type littermates were pulsed with OVA323-339 (10 µg/ml) and cocultured with CFSE-labeled naive CD4+ T cells isolated from OT-2 mice. The proliferation of CD4+ T cells was assessed with flow cytometry by evaluating the degree of CFSE dilution after 4 days in coculture in a 1/3 enriched DCs to T cells ratio. The cells were also stained for the T cell activation marker CD25. Representative data for cells gated based on positive CD4 expression are shown. H Schematic representation of the adoptive T cell transfer experiments. CD4+ T cells were isolated from the spleen of CD45.1 × OT-2 mice, labeled with CFSE and injected i.v. into Sptasph/sph mice or wild-type littermates. Subsequently, the mice were intravenously immunized with ovalbumin protein (75 µg) mixed with an agonistic anti-CD40 antibody. Three days later, the spleens were harvested, CD4+ T cells were negatively enriched and proliferation of CD4+ T cells was assessed by evaluating the degree of CFSE dilution. I Top row: representative density plots of the CD45.1 and CD45. 2 expression in the enriched CD4 fraction isolated from the spleen of immunized mice. Cells were gated based on positive CD4 expression. Bottom row: CFSE dilution in cells gated based on positive CD45.1 and CD4 expression. K Cumulative T cell proliferation data from three independent experiments. The data in F, E, and K are presented as the means ± SDs, and each dot represents one mouse. The data in G are representative of three independent experiments. t-test (F, K); one-way ANOVA with Tukey’s multiple comparison test (E); n.s. not significant, *P ≤ 0.05, **P ≤ 0.01, ***P ≤ 0.001, ****P ≤ 0.0001.

