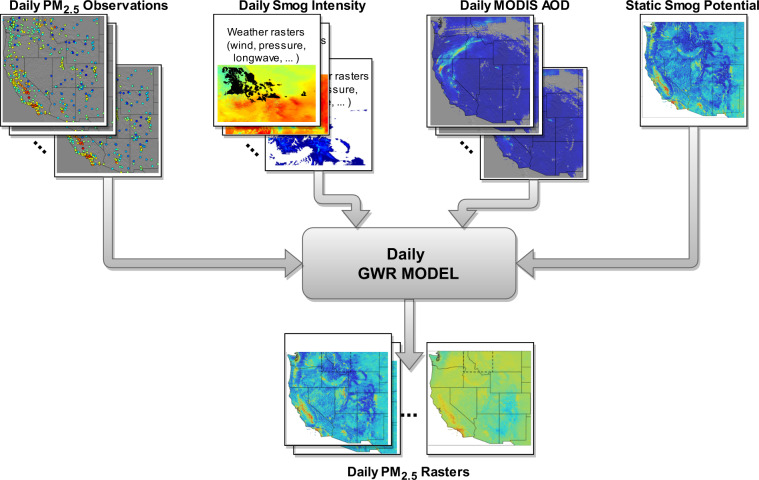
Fig. 1.
Schematic representation of the geographical weighted regression (GWR) modelling framework producing daily PM2.5 rasters (layers). Top row (left to right): Daily PM2.5 point observations from EPA monitoring stations21, daily smog intensity layers at 0.5-deg resolution comprised of various meteorological data from Climate Forecast System Reanalysis23, Daily MODIS data for Aerosol Optical Depth, and the static smog potential layer.

