Fig. 9.

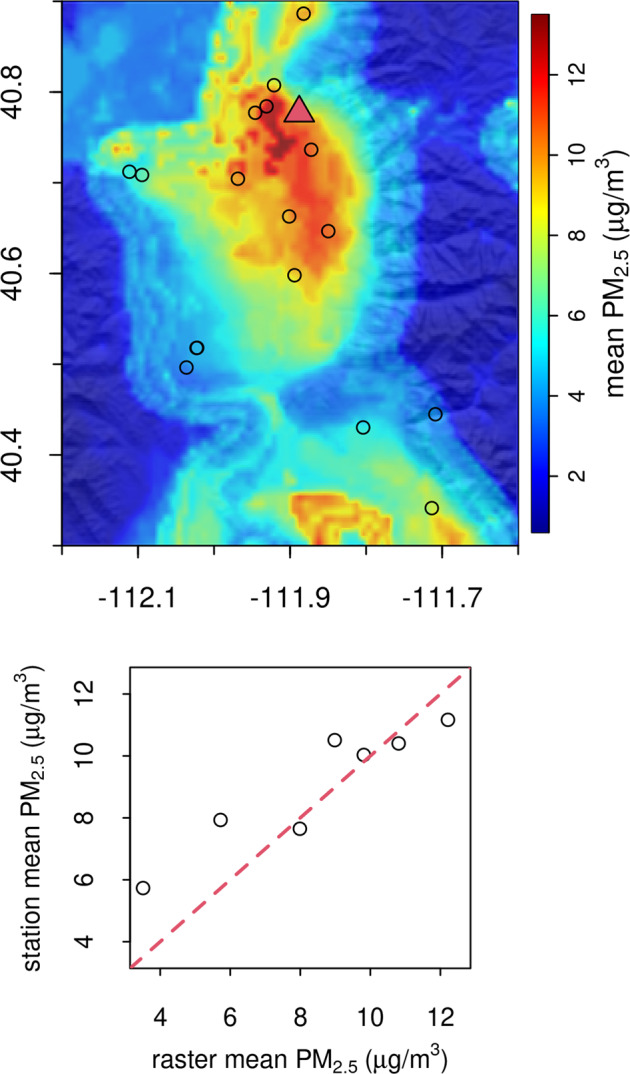
Example 2019 winter mean PM2.5 for Salt Lake City, Utah, USA (red triangle) area. Open circles represent the monitoring stations. Bottom panel shows the relationship between the monitoring stations and the modeled PM2.5 values.

Example 2019 winter mean PM2.5 for Salt Lake City, Utah, USA (red triangle) area. Open circles represent the monitoring stations. Bottom panel shows the relationship between the monitoring stations and the modeled PM2.5 values.