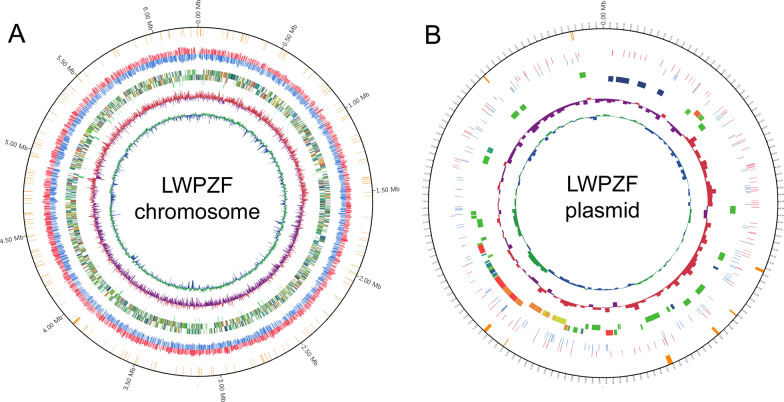
Fig. 3.
Circular genome map of P. putida LWPZF. A Genetic map of the chromosome. B Genetic map of the plasmid. The first circle represents distribution of genes belonging to restrictive modification system. The second and third circles depict the base modification distribution of positive and negative chains, respectively. The fourth and fifth circles show the CDS distribution of positive and negative chains, respectively. The sixth circle represents ncRNA. The seventh and eighth circles represent GC skew and GC content, respectively

