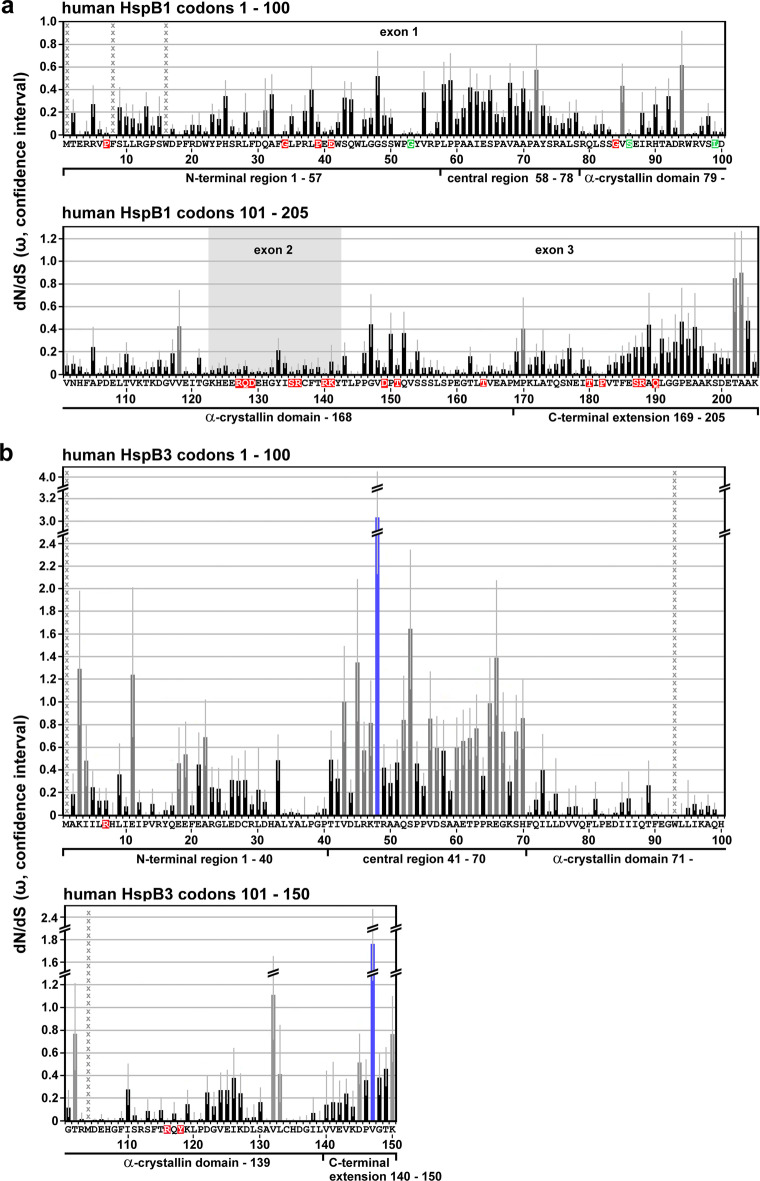
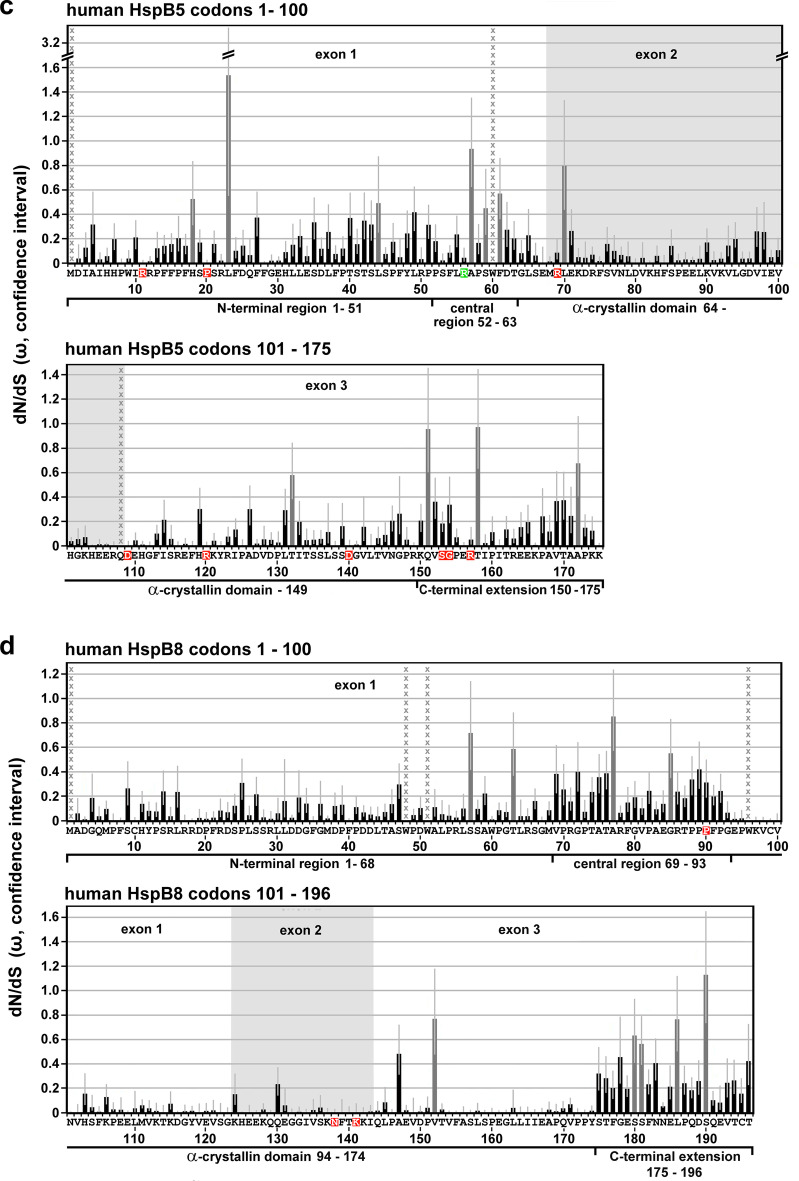
Fig. 1.
Selective pressures along the sequences of human HspB1 (a), HspB3 (b), HspB5 (c) and HspB8 (d) as returned by the FEL algorithm. The dN/dS point estimates were determined for each codon of the aligned Gnathostomata sHSP orthologs, omitting all codons without homologous amino acid residues in the human sequences. The plots show the principal ω-values with the respective confidence intervals (lower and upper bound; light gray error bars) along the primary sequences. No columns or black columns: ω < 1, indicating that these positions were historically exposed to purifying selection, using p ≤ 0.1 as statistical significance threshold; dark gray columns: ω ≈ 1 or near 1, with p > 0.1, indicating neutral evolution; blue columns: ω > 1, with p < 0.1, indicating positive selection. Positions with undefined ω-values are indicated by columns of gray x. Amino acid residues affected by disease-associated missense mutations are highlighted in color (red, green: dominant and recessive disease phenotypes, respectively). Sequence segments (partitions) with relatively low, intermediate or high ω-values in average, as they can be discerned, are indicated and were used to delineate the sequence partitions as used in this study (cf. Table S4). These partitions correspond approximately, though not perfectly, to the NTR, CeR, αCD, and CTE. The exons are indicated where applicable


