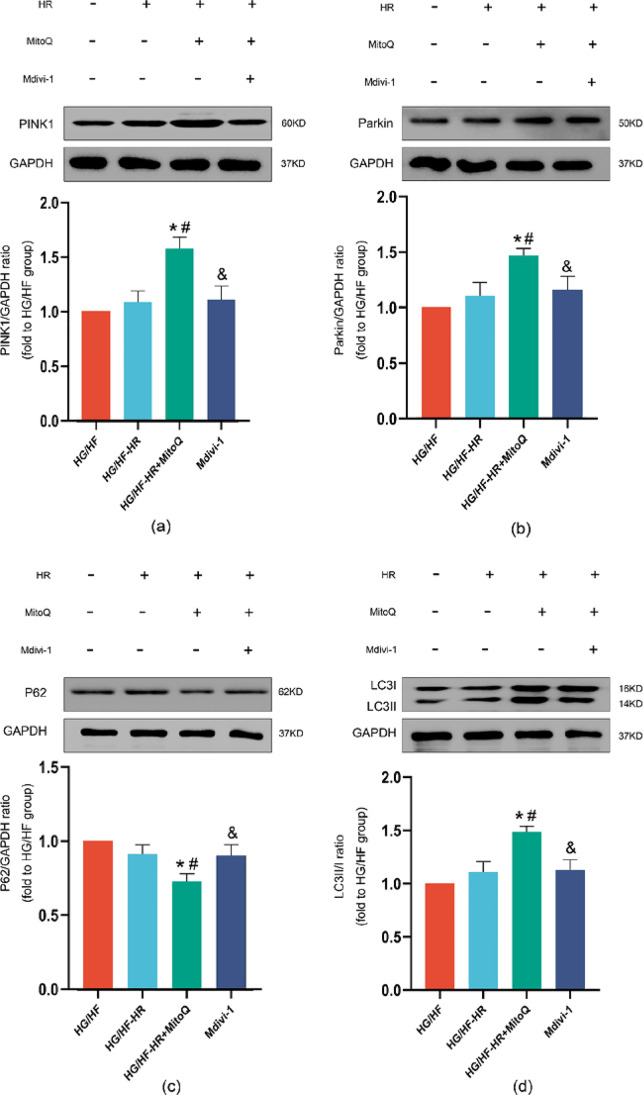
Fig. 6.
Effects of MitoQ and mdivi-1 on expressions of PINK1, Parkin, ratio of LC3II/I and P62. Representative myocardial PINK1 (a), Parkin (b), ratio of LC3II/I (c) and P62 (d) Western blot images and protein level analysis. GAPDH served as the loading control. All values are expressed as the mean ± SD, n = 5/group. ∗P < 0.05 versus HG/HF group; #P < 0.05 versus HG/HF-HR group; &P < 0.05 versus HG/HF-HR + MitoQ group

