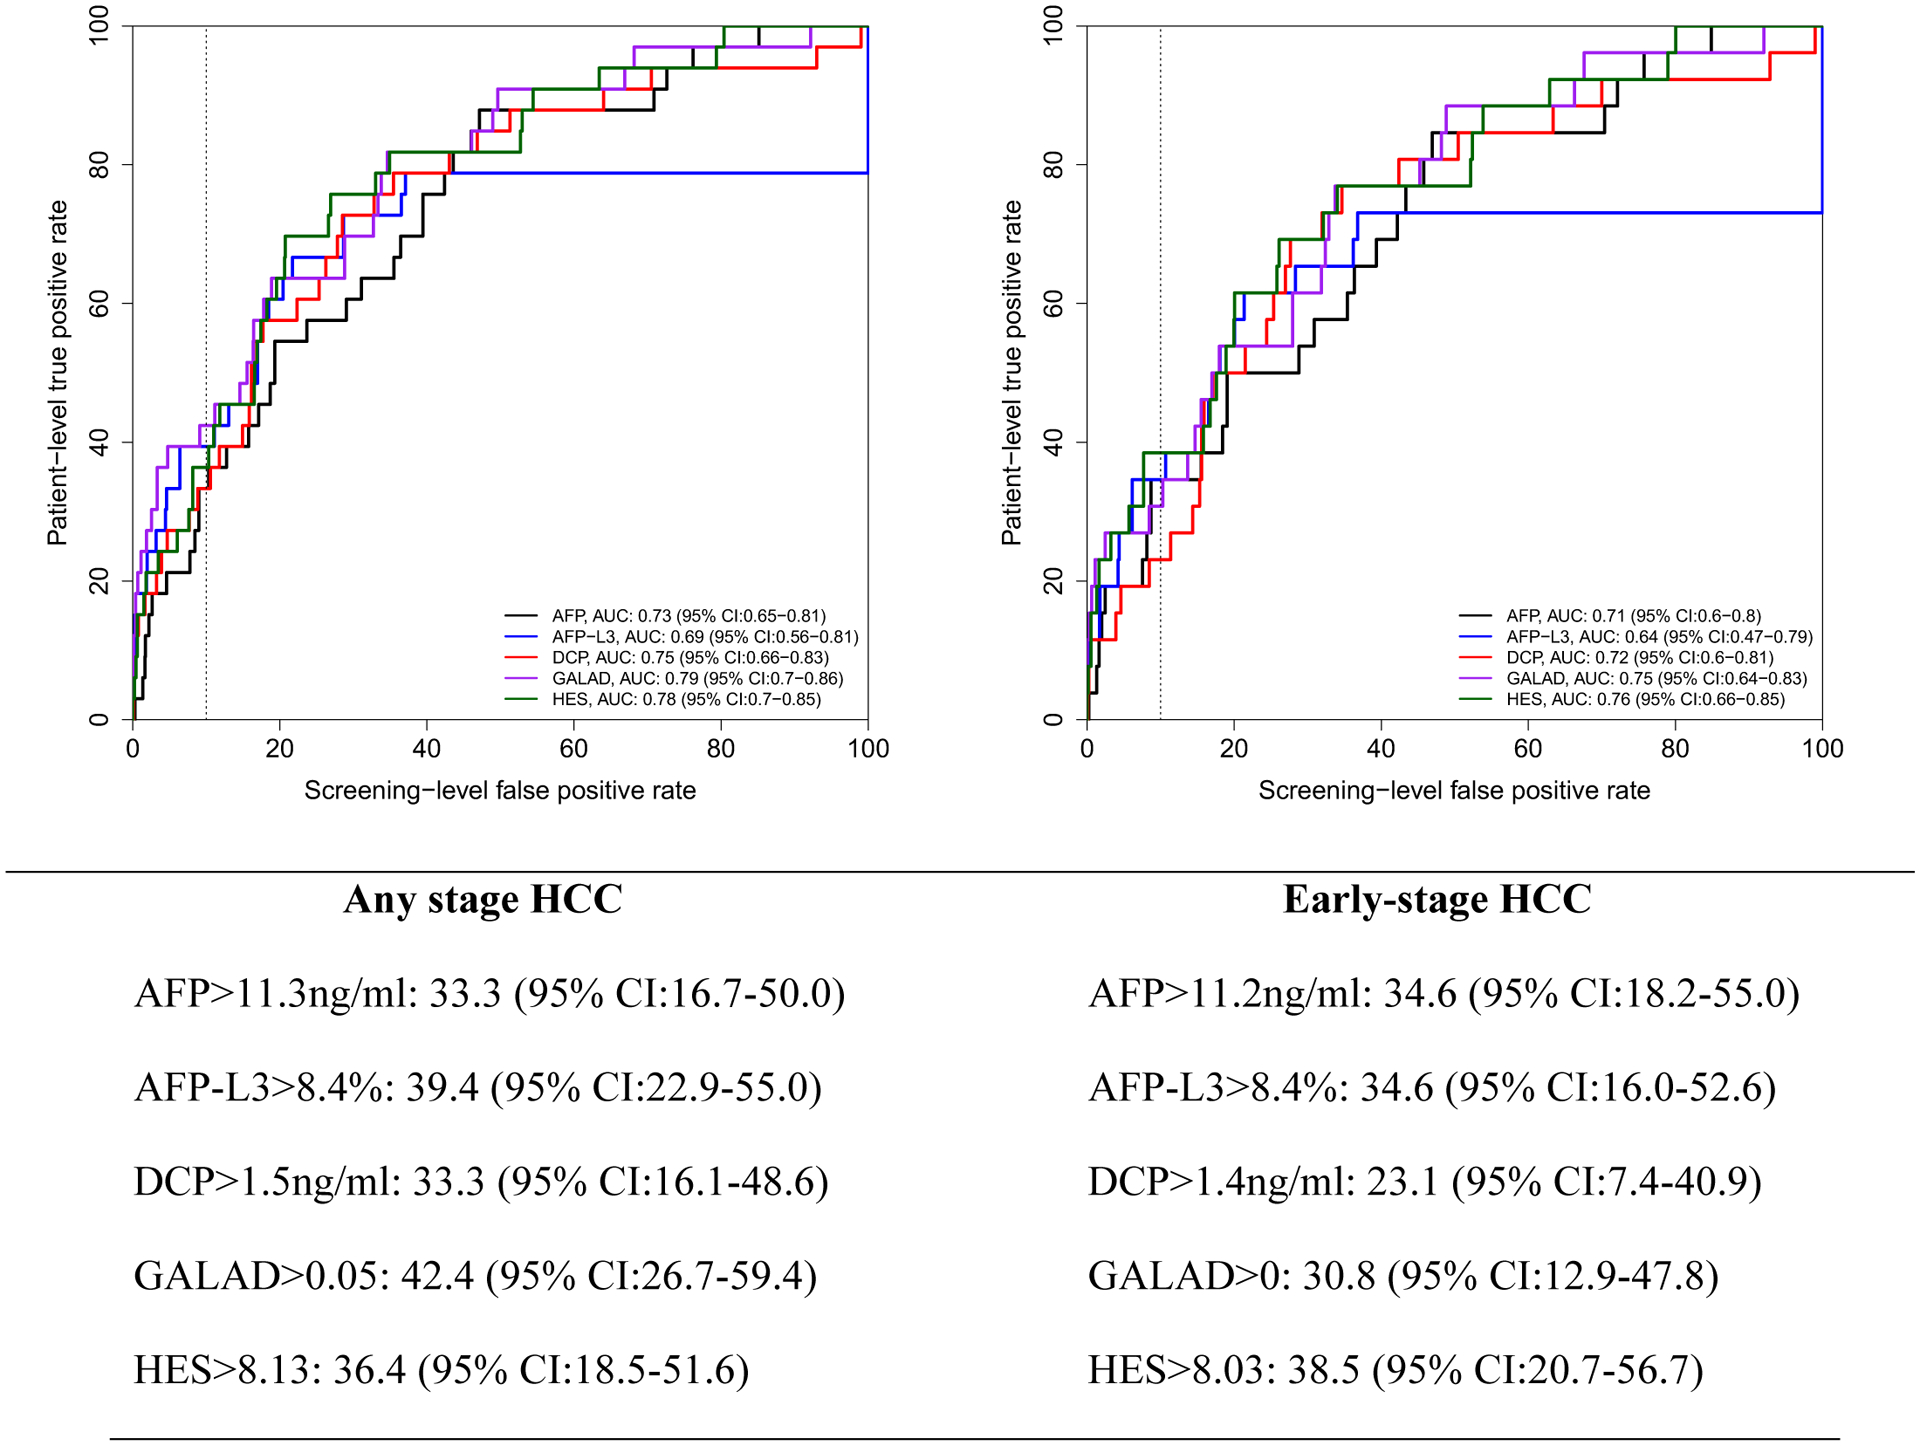
Figure 1:

Receiver operating characteristics (ROC) curve within 6 months prior to HCC diagnosis. Below the figure, we describe patient-level true positive rate at optimal cutoff corresponding to 10% screening-level false positive rate on the ROC curves.
