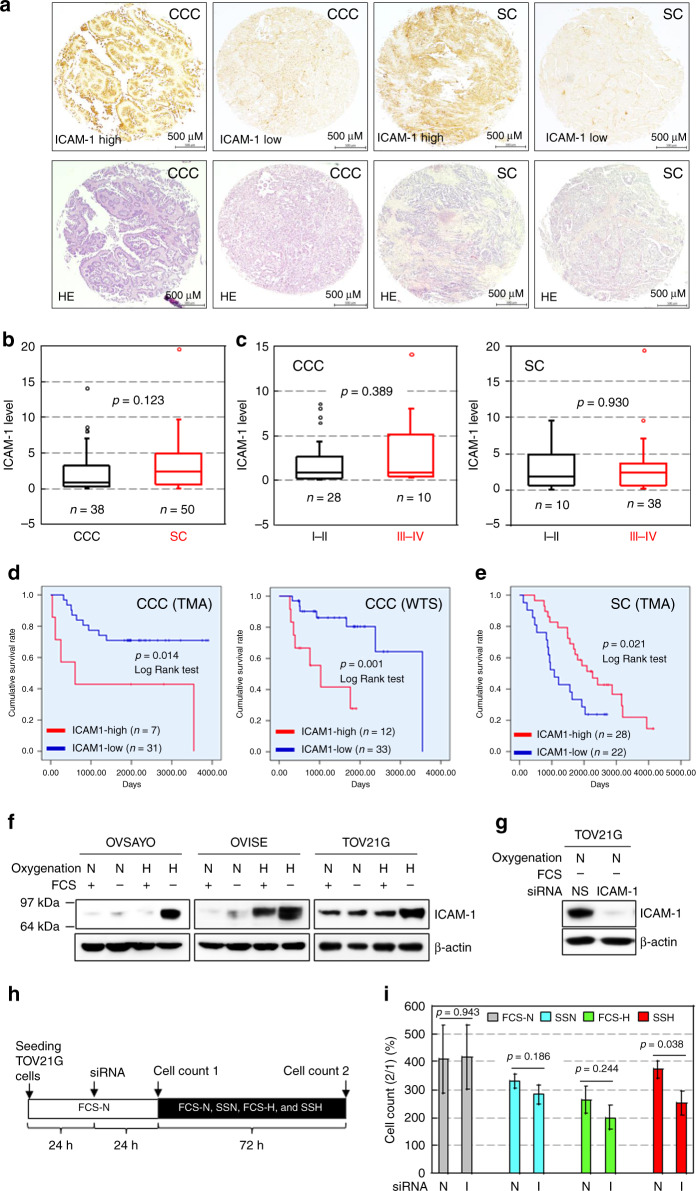
Fig. 1. ICAM-1 level in cancer cells is associated with poor prognoses of CCC patients.
a Staining pattern of ICAM-1 in EOC tissues evaluated by IHC. H&E staining is also shown for comparison. b Comparison of ICAM-1 levels between CCC and SC tissues. c Comparison of ICAM-1 levels between FIGO stages in EOC tissues. d,e Kaplan–Meier analysis of the correlation between the ICAM-1 level and OS of CCC (d) and SC (e) patients. f Western blot analysis of ICAM-1 expression in the indicated cells exposed to the indicated culture conditions for 48 h. FCS: 10% foetal calf serum, N and H indicate normoxia (ambient air) and hypoxia (1% O2), respectively. β-Actin was examined as a protein loading control. g Example of ICAM-1 knockdown (KD) in TOV21G cells. Cells were cultured under the SSN condition for 48 h after the indicated siRNA transfection. NS: non-specific. h Scheme of the cell growth assay. The effect of ICAM-1-KD on proliferation of TOV21G cells was examined under various culture conditions. i Viability of TOV21G cells under the indicated culture conditions. Data are the mean (N = 3) ± SD. Statistical significance was evaluated by the two-sided t-test. N non-specific, I ICAM-1.

