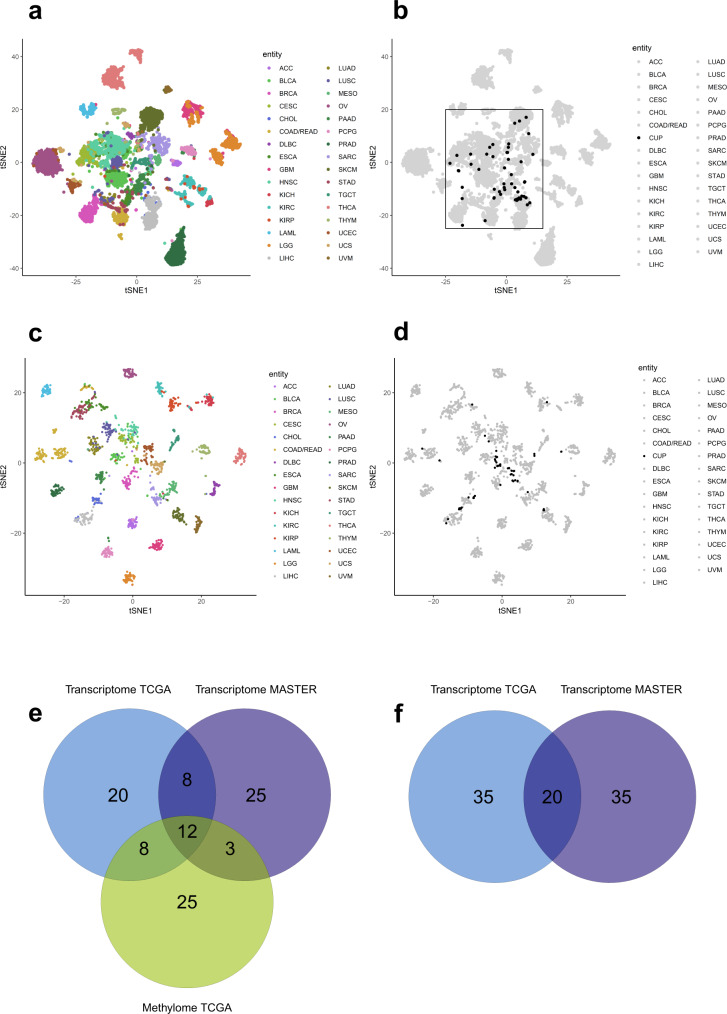
Fig. 2. Methylome and transcriptome-based clustering.
a tSNE plot based on the 5000 most variant CpG sites across the TCGA pan-cancer cohort (n = 8024, 33 different cancer entities in 32 entity baskets). The tSNE analysis was jointly performed on the complete TCGA and MASTER CUP samples (n = 55) to ensure comparability within the landscape. This subplot shows TCGA samples only. While many TCGA entities show distinctive clusters, some do overlap with other entities. b This subplot illustrates all MASTER CUP patients (black) on top of the TCGA sample landscape (gray). CUP samples were close to many entities that did not necessarily cluster distinctively (e.g., gastrointestinal tumors). c Transcriptome-based tSNE clustering of 33 different cancer entities in 32 baskets using TCGA data without CUP patients (n = 1809). d Transcriptome-based tSNE clustering of MASTER CUP patients (black, n = 55) among the background of TCGA-based clusters (gray). As with the methylome-based clustering, a notable fraction of the samples are found in the diffusely structured center of the tSNE clustering. e Venn diagram depicting concurring results between methylome-based CUP entity predictions (comparison to TCGA) and transcriptome-based entity predictions (comparison both to TCGA and MASTER; each depicted in separate groups). 48 patients of the CUP cohort had predictions based on all three methods and were therefore eligible for comparison (Supplementary Data 8). f Venn diagram depicting concurring results between both transcriptome-based CUP entity predictions (TCGA and MASTER comparison). 55 patients of the CUP cohort had transcriptome-based predictions (Supplementary Data 8). Source data are provided as a Source Data file.

