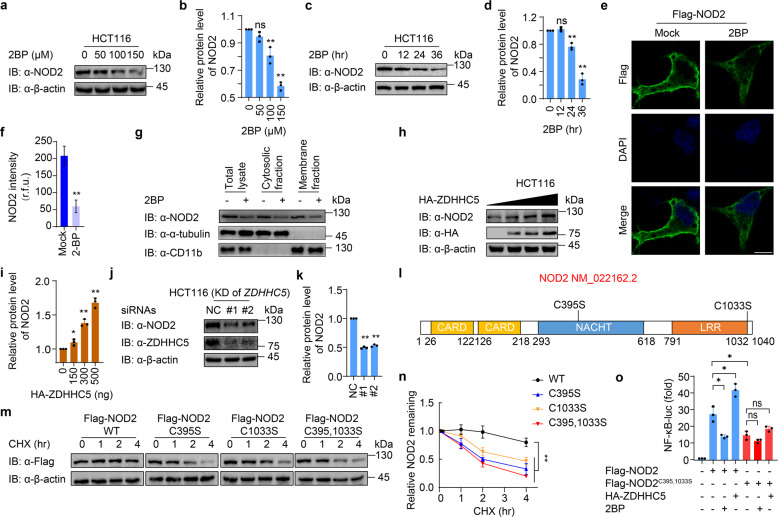
Fig. 1. S-palmitoylation of NOD2 by ZDHHC5 enhances the protein stability of NOD2.
a Immunoblot analysis showing NOD2 degradation in HCT116 cells treated with 2BP at the indicated concentrations (0, 50, 100, and 150 μM) for 24 h. b Quantification of the protein level of NOD2 after 2BP treatment in (a). c Immunoblot analysis showing NOD2 degradation in HCT116 cells treated with 100 μM 2BP for 0, 12, 24, and 36 h. d Quantification of the protein level of NOD2 after 2BP treatment in (c). e Immunofluorescence staining of Flag-NOD2 in HEK293T cells with or without 2-BP (100 μM, 24 h) treatment. The nucleus is stained with 4′,6-diamidino-2-phenylindole (DAPI). Scale bars, 10 μm. f Quantification of the NOD2 intensity (30 cells per sample). r.f.u. relative fluorescence unit. g Cytosolic, and membrane fractions of THP-1-derived macrophages (THP-1-DM) pretreated with DMSO or 2BP (100 μM) for 24 h. THP-1 cells were differentiated with PMA (100 ng/ml) overnight. h Immunoblot analysis showing stabilization of NOD2 in HCT116 cells transfected with 0-500 ng ZDHHC5 for 24 h. i Quantification of the protein level of NOD2 after overexpression of ZDHHC5 in (h). j Immunoblot analysis showing NOD2 degradation in HCT116 cells after knockdown of ZDHHC5 for 36 h. k Quantification of the protein level of NOD2 with overexpression of ZDHHC5 in (j). l Schematic view of NOD2 (full-length) and the location of the S-palmitoylation-deficient NOD2 variants. m Immunoblot analysis showing the stability of wild-type (WT) or S-palmitoylation-deficient NOD2 mutants. Cells were treated with CHX (100 μg/ml) for 0, 1, 2 and 4 h, and then collected and lysed for IB. n Quantification of WT or S-palmitoylation-deficient NOD2 mutants in (m). o NF-κB-dependent luciferase reporter gene activities in HEK293T cells expressing Flag-NOD2 or Flag-NOD2C395,1033S, together with HA-empty vector or HA-ZDHHC5, treated with DMSO or 2BP (100 μM, 24 h). NF-κB promoter-driven luciferase activity was measured and normalized to the renilla luciferase activity. In b, d, f, i, k, n, and o, all error bars, mean values ± SEM, P values were determined by unpaired two-tailed Student’s t-test of n = 3 independent biological experiments. *P < 0.05; **P < 0.01; ns not significant. For a, c, e, g-h, j, and m, similar results are obtained from three independent biological experiments.

