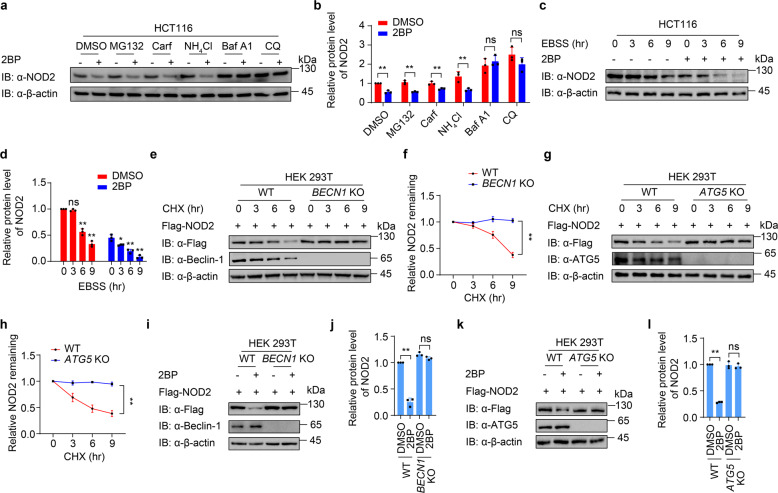
Fig. 2. Palmitoylation attenuates the autophagic degradation of NOD2.
a Immunoblot analysis showing NOD2 protein level in HCT116 cells treated with proteasome inhibitors MG132 (10 μM), carfilzomib (100 nM), or autolysosome inhibitor ammonium chloride (NH4Cl, 20 mM), bafilomycin A1 (Baf A1, 0.2 μM), or chloroquine (CQ, 50 μM) for 6 h. b Quantification of relative protein level of NOD2 in (a). c Immunoblot analysis showing NOD2 degradation in HCT116 cells treated with DMSO or 2BP (100 μM, 24 h) upon starvation-induced autophagy activation under Earle’s balanced salt solution (EBSS)-cultured condition for 0, 3, 6 or 9 h. d Quantification of relative protein level of NOD2 in (c). e, h Immunoblot analysis showing protein level of Flag-NOD2 in wild-type (WT) and BECN1 (e) or ATG5 (g) knockout (KO) HEK293T cells. Cells were transfected with Flag-NOD2 for 24 h, and then treated with CHX (100 μg/ml) for 0, 3, 6 and 9 h. f, h Quantification of relative NOD2 remaining in (e and g). i–l Immunoblot analysis showing protein level of Flag-NOD2 in WT and BECN1 (i, j) or ATG5 (k, l) KO HEK293T cells treated with DMSO or 2BP (100 μM, 24 h). j, l Quantification of relative protein level of NOD2 in (i and k). In b, d, f, j, and l, all error bars, mean values ± SEM, P values were determined by unpaired two-tailed Student’s t-test of n = 3 independent biological experiments. *P < 0.05; **P < 0.01; ns not significant. For a, c–e, g, i, k, similar results are obtained from three independent biological experiments.

