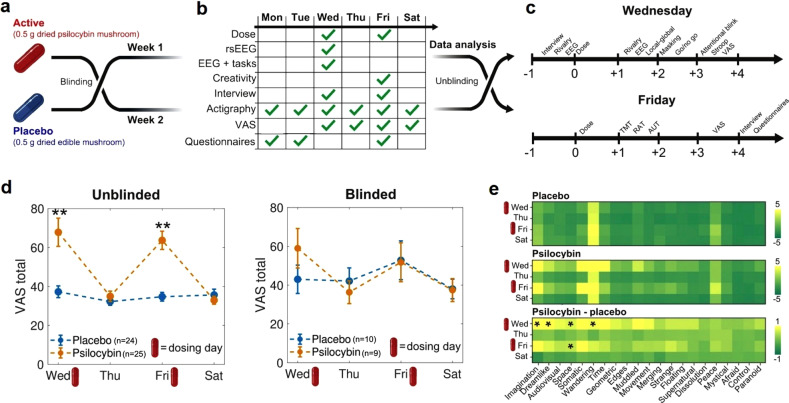
Fig. 1. Experimental design and acute effects.
a Neither the subjects nor the investigators knew the content of the capsules (active dose or placebo) until the last steps of the data analysis stage. Each condition (active dose or placebo) corresponded to 1 week of the experiment, separated by 1 week. b Measurements conducted during each day of the week. c Timelines for the measurements performed during dosing days (Fridays and Wednesdays). d VAS total score (mean ± SEM) per condition, from Wednesday (first dosing day of the week) to Saturday (last day of the experiment), obtained from the “unblinded” (left) and “blinded” (right) subsets of the data. **p < 0.05, Bonferroni corrected (n = 4). e VAS scores per item, day of the experiment and experimental condition. The bottom matrix contains the difference between the active dose and the placebo. *p < 0.05, uncorrected for multiple comparisons.

