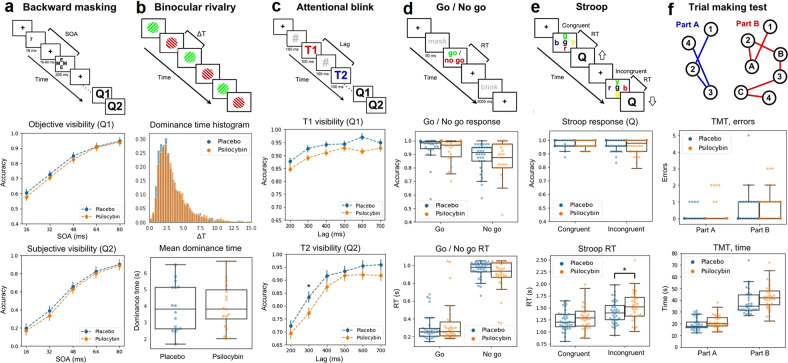
Fig. 3. Results of tasks used to assess perception and cognition.
The uppermost panel of each column contains a diagram of the task. a Backward masking. A target (number 7) is flashed and then masked; the time elapsed between target and mask is the stimulus onset asynchrony (SOA). Participants were queried for objective (Q1, comparison with number 5) and subjective (Q2) visibility. The panels below show the objective and subjective accuracy vs. SOA. b Binocular rivalry. Two different gratings were presented to each eye, resulting in alternation of the perceived grating, with the duration of the percept before switching being given by ∆T (dominance time). The panels below show the histograms of ∆T values and a comparison of <∆T> between conditions. c Attentional blink. A sequence of digits (separated by 100 ms) contains two target numbers (T1, T2), participants were required to identify both targets (Q1, Q2). Below, the rate of correct answers to Q1 and Q2. The visibility of the second target for lag 300 ms was reduced in psilocybin vs. placebo (p < 0.05, uncorrected). d Go / No Go. A mask is presented, followed by instructions to press a key (“Go”) or pass (“No Go”), registering accuracy and response times (RT). These two variables are shown in the panels below. Response times were slower for psilocybin vs. placebo (*p < 0.05, uncorrected). e Stroop. Participants were presented with the name of a color written in either the same (congruent) or different (incongruent) color, and asked to identify the color of the word (Q). The next two panels show the accuracy and the RT. f The participants were asked to join with lines dots with numbers (part A) or with alternating numbers and letters (part B), in both cases in increasing order. The remaining two panels show the rate of errors for each part of the task.

