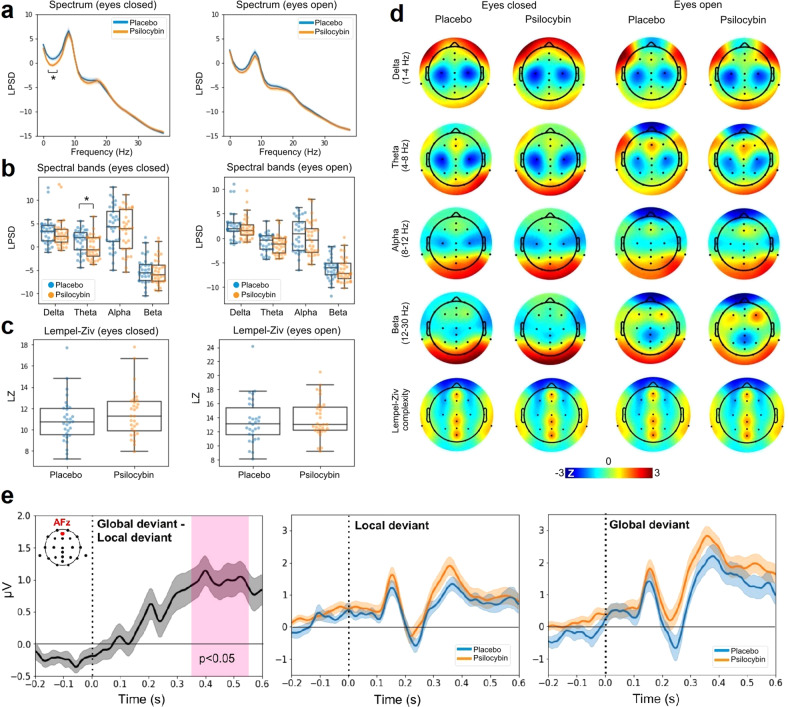
Fig. 4. Results of the resting state EEG analysis.
a LPSD vs. frequency (averaged across all channels) for eyes closed (left) and open (right), both for the placebo and the active dose (mean ± SEM). b Same as in panel A, but binned using the following bands: delta (1–4 Hz), theta (4–8 Hz), alpha (8–12 Hz) and beta (12–20 Hz). c Global Lempel-Ziv complexity computed using the broadband EEG signal, compared between psilocybin and placebo conditions for eyes closed and open. d Topographic distribution of spectral power and Lempel-Ziv complexity for all combinations of active dose, placebo, eyes open and closed. e Results of the Local-Global ERP analysis. Left: global deviant minus local deviant ERPs located at AFz for the the placebo condition. Center: local deviant at AFz for placebo vs. psilocybin. Right: same as in panel C but for the global deviant. All ERP plots show mean ± SEM. The vertical dashed lines coincide with the timing of the last sound in the trial. *p < 0.05 for the comparison between placebo and active dose (corrected for multiple comparisons).

