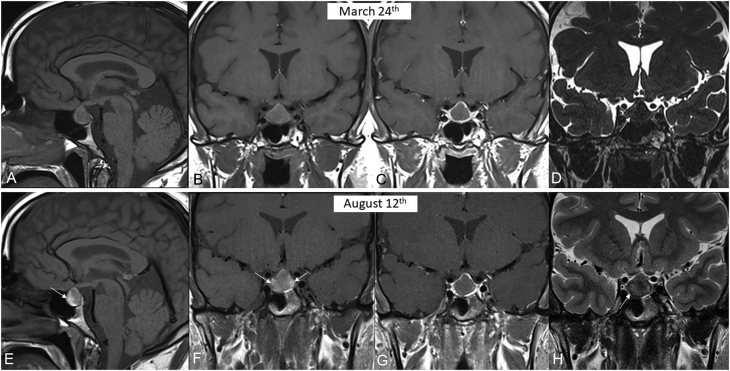
Figure 2.
MRI in patient 2 at the time of diagnosis (upper arrow) and 5 months later (lower arrow). (A) Pre-contrast mid-sagittal T1-weighted view revealing a pituitary mass of intermediate and homogeneous signal intensity. (B) Pre-contrast T1-weighted view showing similar findings. (C) Post-contrast T1-weighted view in similar slice location as (B) revealing only a very thin marginal enhancement of the mass with complete devascularisation of its core. (D) Coronal T2-weighted view in similar slice location as (B, C) revealing strong hypointensity of the mass. (E) Pre-contrast mid-sagittal T1-weighted view in similar slice location as (A) revealing only a qualitative change with appearance of hypersignal intensity at anterior border of the mass (arrow) due to increase in protein concentration. (F) Pre-contrast T1-weighted view in similar slice location as (B) confirming subtle intensity changes (arrows). (G) Post-contrast T1-weighted view in similar slice location as (C) failing to reveal any change when compared to (C). (H) Coronal T2-weighted view in similar slice location as (D) revealing appearance of subtle areas of slightly increased signal intensity (arrows) mainly due to technical differences between (D) and (H).

 This work is licensed under a