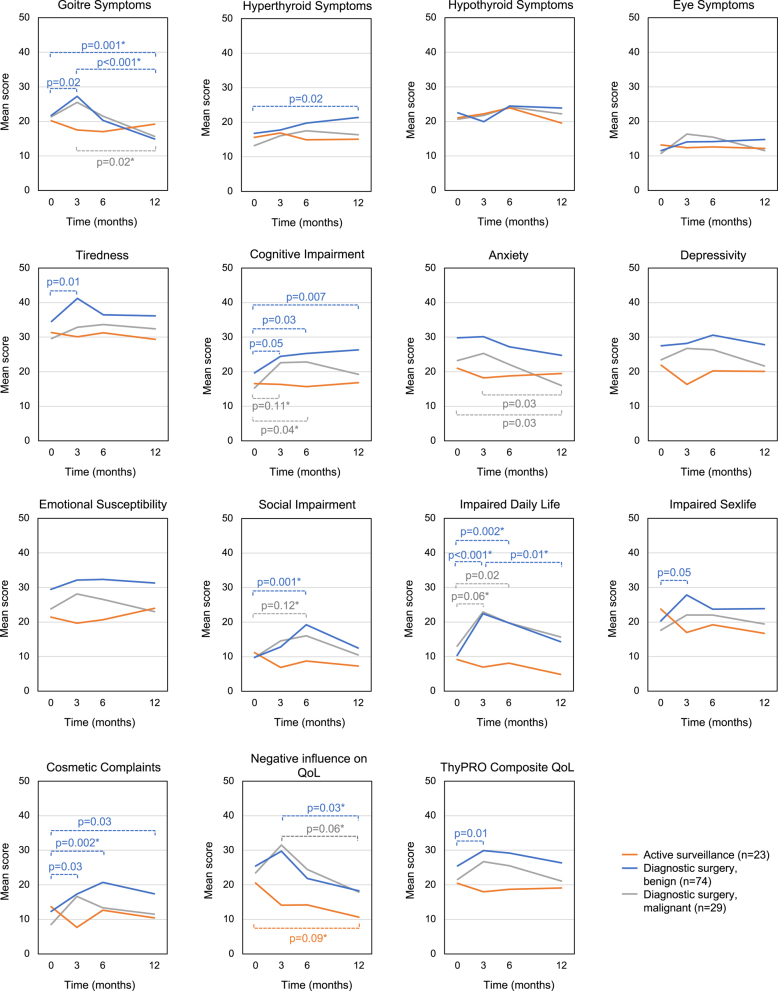
Figure 2.
Within-group changes in mean ThyPRO scores over time. For the ThyPRO, scores range from 0 (best score) to 100 (worst score). The P value indicates the statistically significant within-group differences between two assessments over time, using a paired samples t-test. Full data, including mean differences and other P values, are presented in Supplementary Table 3. *Indicates clinically relevant difference using the MIC values established by Nordqvist et al. (31). MIC, minimally important change; ThyPRO, Thyroid Patient-Reported Outcome.

 This work is licensed under a