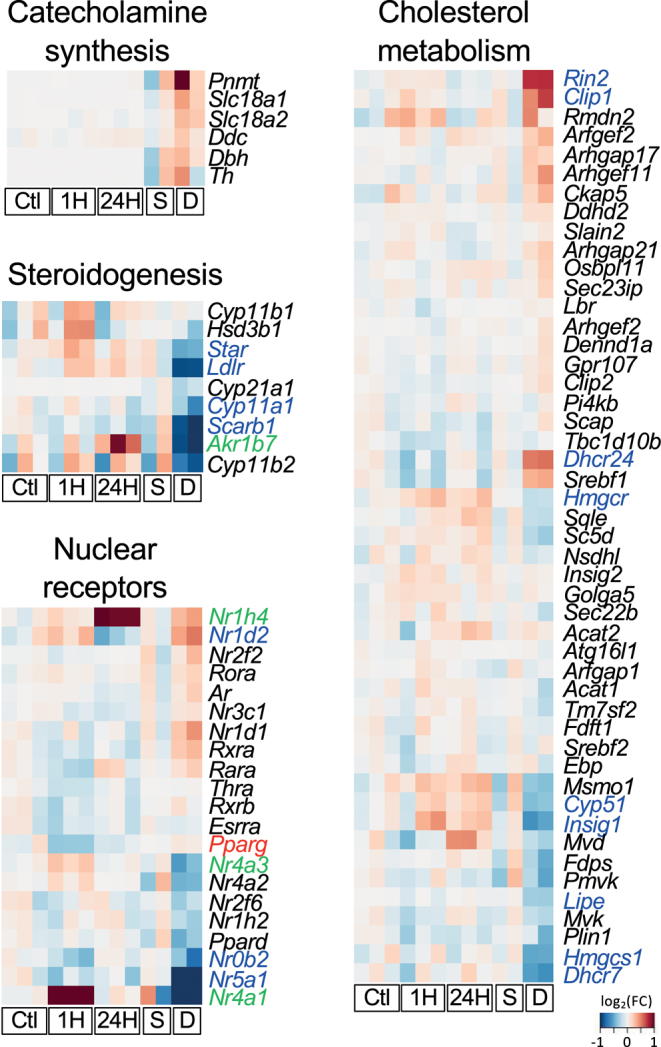
Figure 4.

Heatmaps of the genes related to adrenal gland functions, cholesterol metabolism, and nuclear receptors in the adrenal gland. Heatmaps showed the fold change of Dex-treated groups vs control groups. The fold change was calculated based on FPKM +10 to reduce the influence of low expressing genes. Genes must have an original FPKM > 10 in at least one sample to be included in these heatmaps. Gene names in blue, red, or green were identified as DEGs in vivo, in vitro, or both groups, respectively. Ctl, vehicle control (in vitro); 1H, 1-h Dex-treated group (in vitro); 24H, 24-h Dex-treated group (in vitro); S, saline-treated group (in vivo); D, Dex-treated group (in vivo).

 This work is licensed under a