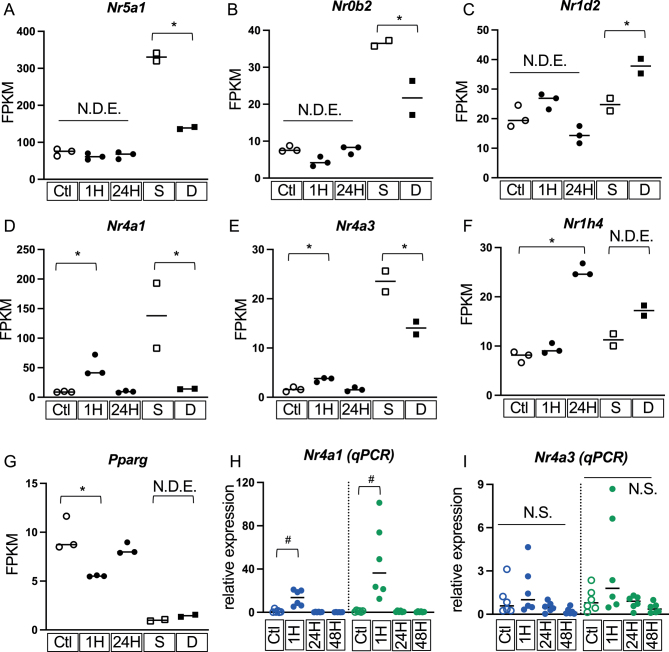
Figure 5.
Expression of differentially expressed nuclear receptors. Dot plots showed (A, B, C, D, E, F, G) FPKM levels with means. (H and I) qPCR was used to verify the transient differential expression of Nr4a1 and Nr4a3. Data in blue used Gapdh as the internal control gene. Data in green used Rplp0 as the internal control gene. The relative expression of the untreated control was set as one. *Identified as DEGs using DESeq2 in the RNA-seq; #Identified as genes with a significant difference with the control group (t-test, P < 0.05); N.S., no significant difference (t-test); N.D.E., not differently expressed using DESeq2 in the RNA-seq. Ctl, vehicle control (in vitro); 1H, 1-h Dex-treated group (in vitro); 24H, 24-h Dex-treated group (in vitro); 48H, 48-h Dex-treated group (in vitro); S, saline-treated group (in vivo); D, Dex-treated group (in vivo).

 This work is licensed under a