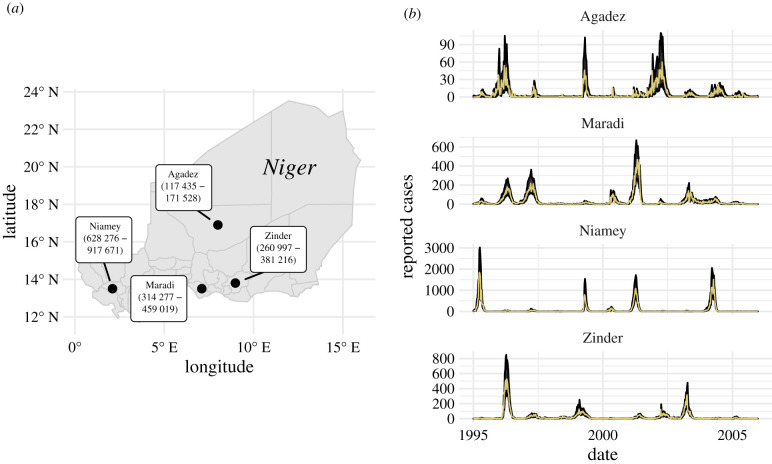
Figure 1.
Locations of data sources and observed and predicted measles dynamics. (a) Locations and 1995–2005 population-size ranges (in parentheses) of our four focal cities in Niger. (b) Time series of weekly reported cases (incidence data; yellow solid lines) and the 68% prediction intervals (black ribbons) for one-week-ahead predictions from our fitted susceptible-exposed-infected-recovered (SEIR) models for each city.

