Figure 2.
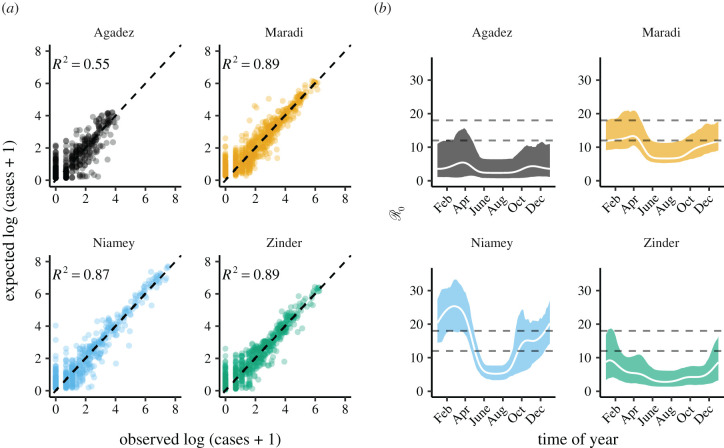
Accuracy of the fitted SEIR models and estimated seasonality. (a) Comparison of in-sample model predictions and observations for each city. Expected cases are one-week-ahead predictions from the fitted models. The dashed line shows 1 : 1. Coefficients of determination (R2) were calculated as the reduction in the sum-of-squared errors from model predictions relative to a null model of the mean number of cases (Material and methods). (b) The estimated seasonality of the basic reproductive ratio () for each city. was approximated as: ηβt/((η + ν)(γ + ν)), where 1/η is the incubation period, 1/γ is the infectious period, βt is the time-specific rate of transmission, and ν is the death rate. Only βt is estimated by our model. We set , , and ν = 0.05 for calculating as shown in this figure. The white line is calculated using the MLE parameters; shaded regions are the bootstrapped 95% confidence intervals. The dashed horizontal lines show the common range of measles .

