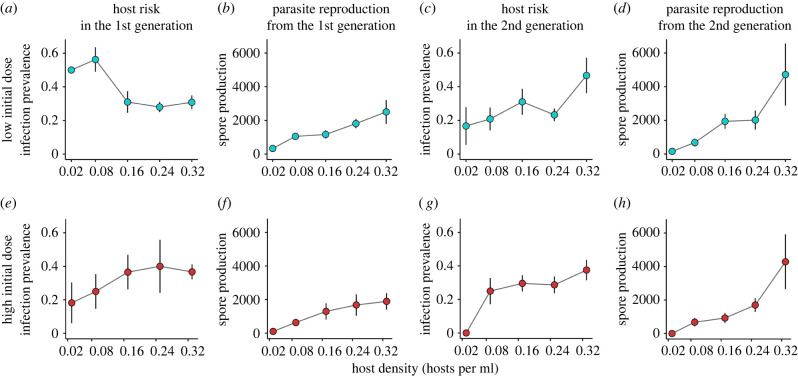
Figure 2.
Effects of host density on host risk and parasite reproduction through time. For each initial spore dose (rows), we provide the relationship between host density and host risk (infection prevalence) and parasite reproduction (spore production) over time. The plots follow the timeline of the experiment (figure 1). (a) In the low initial dose (top row), host risk in the 1st generation declines with density, supporting safety in numbers. (b) However, parasite reproduction resulting from the 1st generation increases with host density. (c) Higher parasite reproduction leads to increased host risk with density in the 2nd generation, supporting density-dependent transmission. (d) The positive relationship between host density and parasite reproduction is maintained at the end of the 2nd generation. Thus, in the low initial dose, we observed safety in numbers reverse to density-dependent transmission with increasing timescale. In the high initial dose, we did not observe safety in numbers. (e) Host risk in the 1st generation trended positively with host density, and (f) parasite reproduction resulting from the 1st generation increased with host density. These same patterns continued in the second generation (g and h). Each point represents the average value from a treatment, with bars for standard error. (Online version in colour.)

