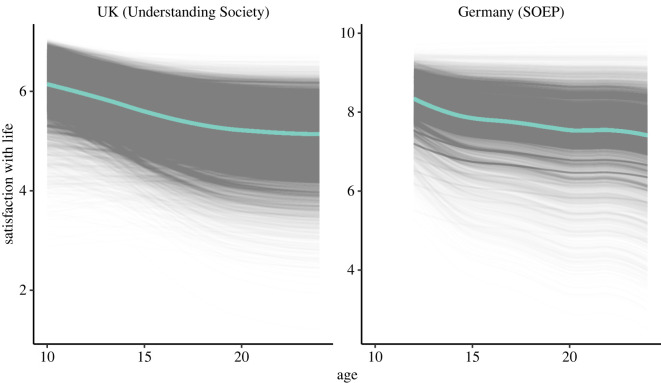
Figure 2.
Longitudinal life satisfaction trajectories in UK and German data, for the ages of 10–24 years and 12–24 years, respectively. Latent growth curve estimated life satisfaction trajectories for adolescents (black lines) and trajectory for a simulated adolescent with a mean life satisfaction at ages 10 and 12, respectively (teal line).

