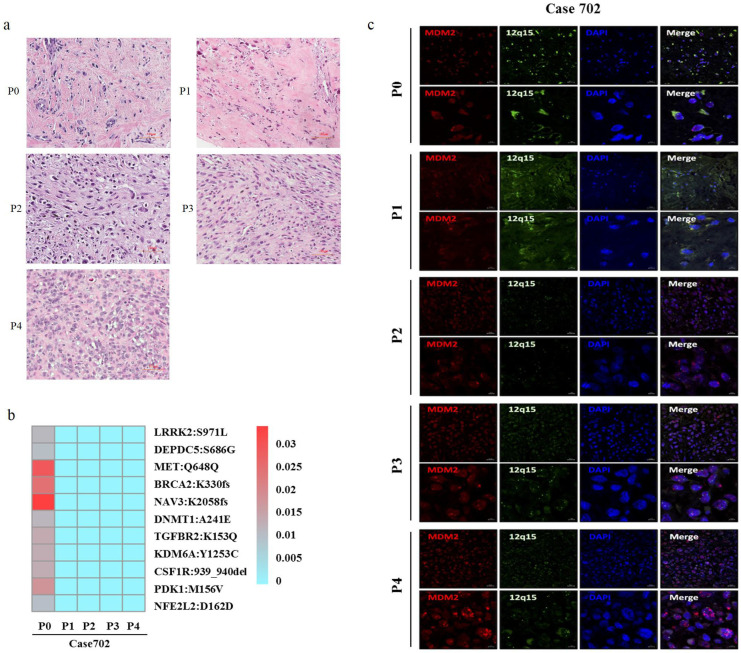
Figure 2.
Genetic features of primary tumors and corresponding P1-P4 PDXs in Case702. (a) HE staining of Case702 and corresponding PDXs. Scale bars, 100 μm. (b) In Case702, low-frequency gene mutations with the highest frequency not exceeding 0.03 was detected in the original tumor (P0), and no additional obvious mutations of these genes could be detected in P1-P4 PDXs. (c) FISH analysis showed that both P0 tumor and P1-P4 PDXs had MDM2 amplification (red fluorescence). Green fluorescence indicated chromosome 12, blue fluorescence showed the nucleus stained by DAPI. Scale bars, 20 μm and 5μm.

