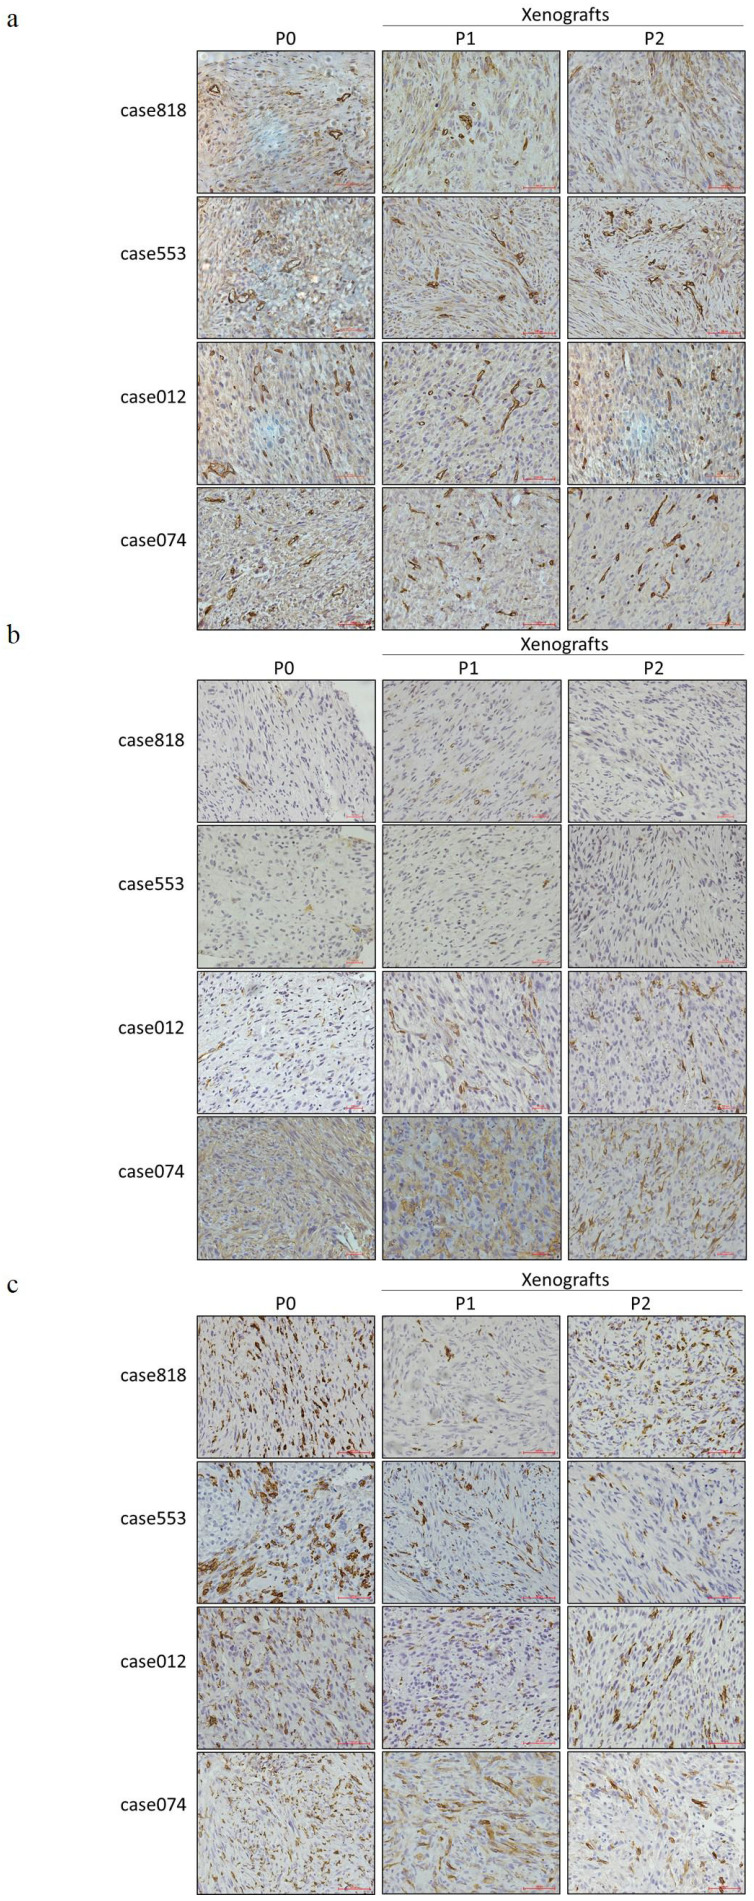
Figure 4.
Expression of tumor microenvironment components in RLPS tissues and corresponding P1-P2 PDX models. (a) Representative IHC staining of CD34. P0 and P1-P2 PDX models are of high microvessel density. (b) Representative IHC staining of α-SMA. P0 and P1-P2 PDXs are both of CAFs infiltration. (c) Representative IHC staining of CD163. P0 and P1-P2 PDXs are both of TAMs infiltration. Scale bars, 100 μm.

