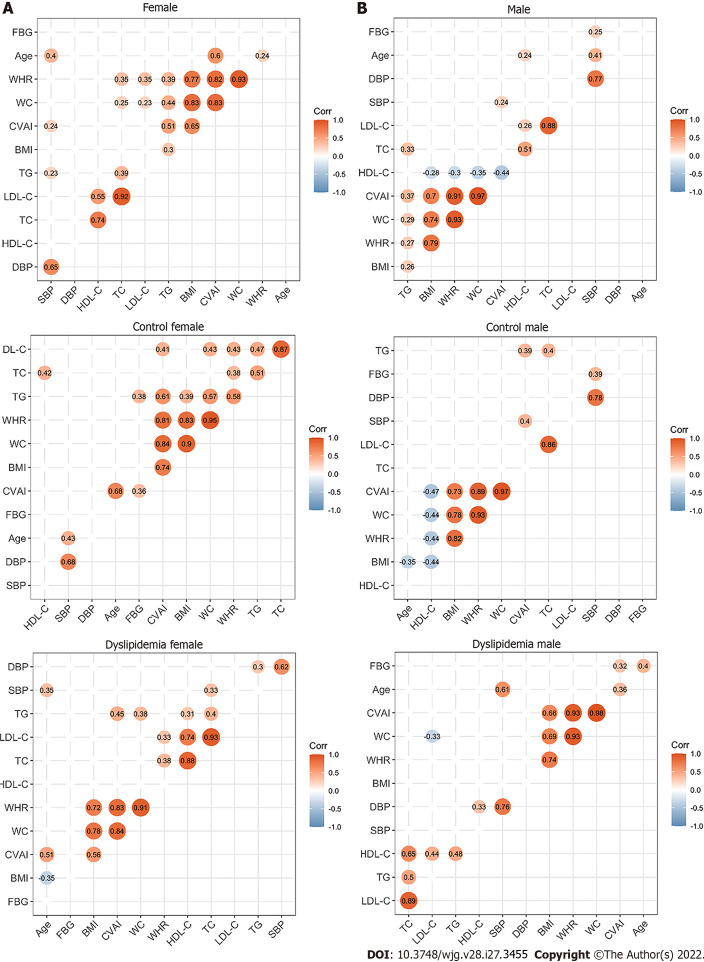
Figure 2.
Correlations between the clinical characteristics in the study population. A: Correlations between the clinical characteristics of the enrolled females; B: Correlations between the clinical characteristics of the enrolled males. The circle represents the correlation coefficient of each two parameters (P value < 0.05). The number presented in the circle is the correlation coefficient. The larger the absolute value is, the stronger the correlation is. Blue indicates a negative correlation and orange indicates a positive correlation. The depth of the color represents the strength of the correlation. The deeper the color is, the stronger the correlation is. The “ggcorrplot” package in R was utilized for Spearman’s correlation analysis. WC: Waist circumference; BMI: Body mass index; WHR: Waist circumference/height ratio; SBP: Systolic blood pressure; DBP: Diastolic blood pressure; TG: Triglyceride; TC: Total cholesterol; LDL-C: Low-density lipoprotein cholesterol; HDL-C: High-density lipoprotein cholesterol; CVAI: Chinese visceral adiposity index.

