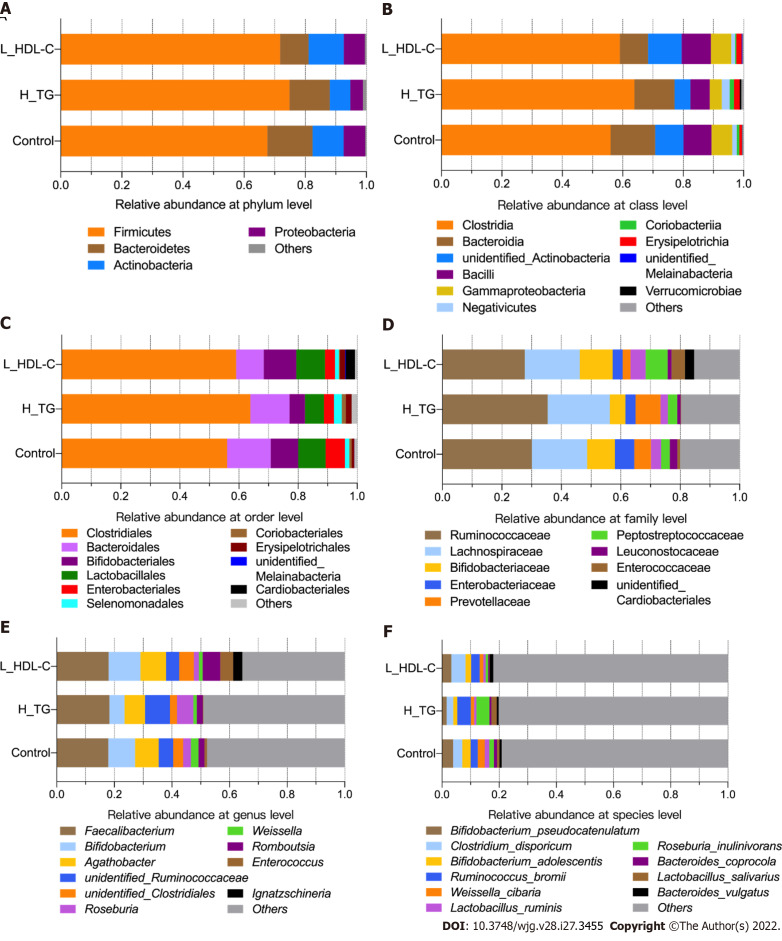
Figure 5.
The taxonomic composition of gut microbiota in males of the study population. Bar plots show the relative abundances of the top ten taxa at the six taxonomic levels, including phyla, class, orders, family, genus and species, in males. Each component of the cumulative bar chart indicates a phylum, a class, an order, a family, a genus or a species. A: Relative abundance at phylum level; B: Relative abundance at class level; C: Relative abundance at order level; D: Relative abundance at family level; E: Relative abundance at genus level; F: Relative abundance at species level. H_TG: high triglyceride; L_HDL-C: Low high-density lipoprotein cholesterol.

