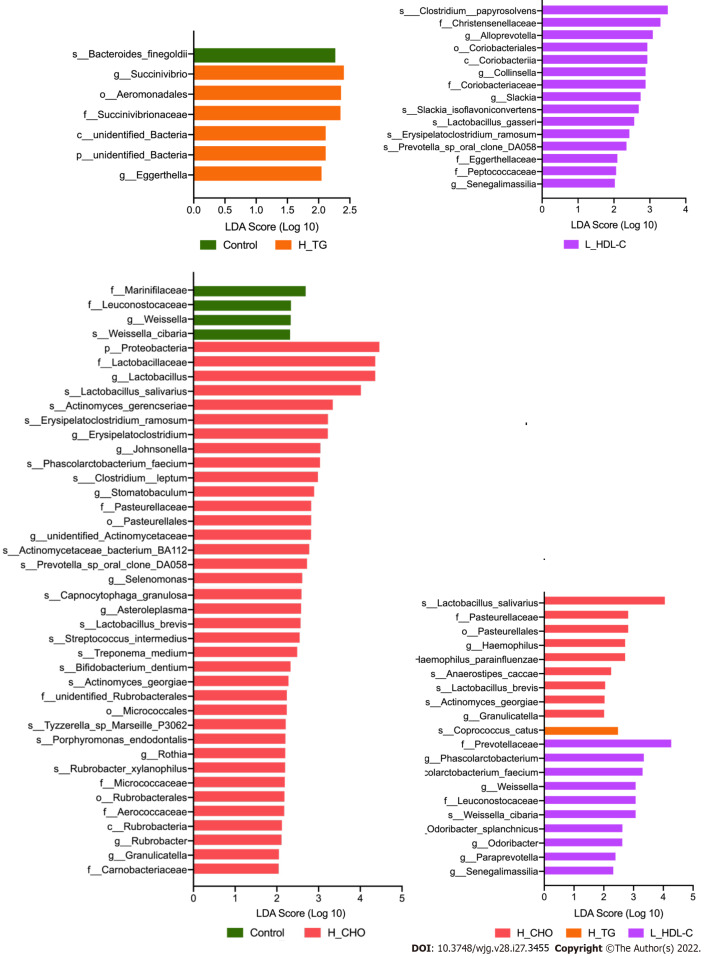
Figure 6.
Linear discriminant analysis effect size analysis in females of the study population. Linear discriminant analysis (LDA) scores indicate differentially represented gut microbiota taxa (biomarkers) in each female subgroups. The length of each bar represents the LDA score format with log 10, and the logarithmic threshold for discriminative features was set to 2.0. H_CHO: High total cholesterol; H_TG: high triglyceride; L_HDL-C: Low high-density lipoprotein cholesterol.

