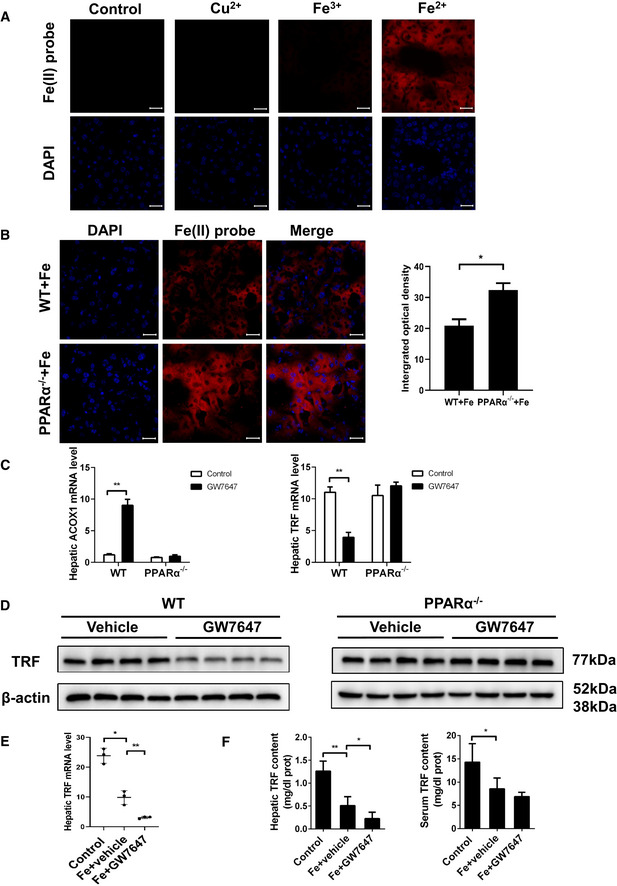
Figure 3. PPARα deficiency influences iron metabolism in the liver.

- Fluorescent images of labile Fe2+ in hep1‐6 cells. Hep1‐6 cells were incubated with control, 20 μM probe1 for 30 min; 20 μM Cu2+ for 30 min then 20 μM probe1 for another 30 min; 20 μM Fe3+ for 30 min then 20 μM probe1 for another 30 min; 20 μM Fe2+ for 30 min then 20 μM probe1 for another 30 min; All scale bars are 20 μm. n = 3 biological replicates.
- Liver sections were obtained from the indicated mice and stained with probe1. All scale bars are 20 μm. n = 3 biological replicates.
- Hepatic Acox1 and TRF mRNA levels were measured in the WT and PPARα−/− mice with or without GW7647 treatment. n = 3–5 mice/group.
- TRF protein was measured in liver of WT and PPARα−/− mice fed blank solvent or GW7647. n = 4 biological replicates.
- Hepatic TRF mRNA levels were measured in the indicated mice. n = 3–5 mice/group.
- Hepatic and serum TRF content were measured in the indicated mice. n = 3–5 mice/group.
Data information: mRNA levels were normalized to 36B4 and are expressed relative to the mean value of the WT group. Data are presented as means ± SD. *P < 0.05, **P < 0.01, determined by ANOVA.
