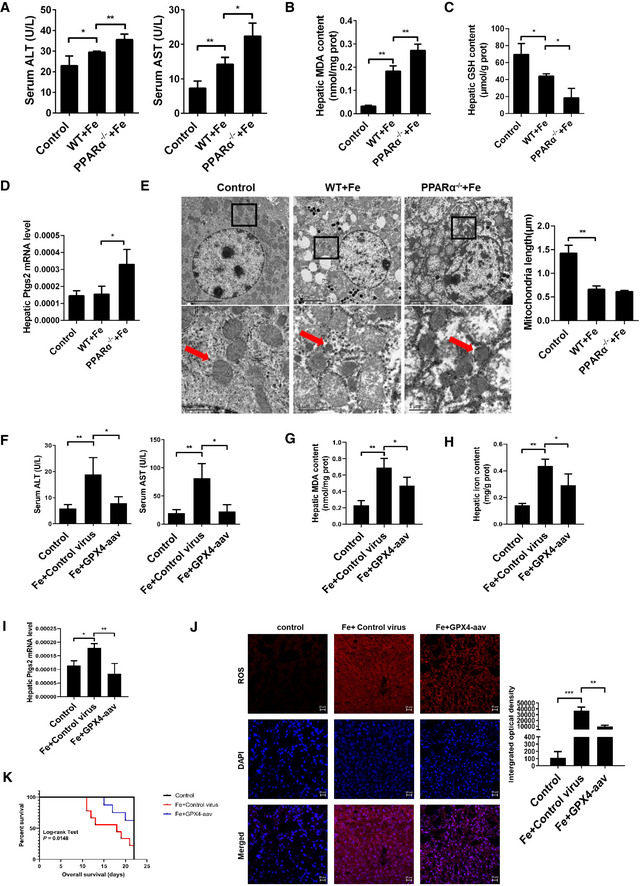
Figure 4. PPARα deletion increases susceptibility to iron overload‐induced ferroptosis.

-
ASerum ALT and AST levels were measured in 8‐week‐old WT, PPARα−/− mice that fed a normal diet or a HID; n = 3–5 mice/group.
-
B–DHepatic MDA content (B), hepatic GSH content (C), hepatic Ptgs2 mRNA levels (D) were measured in the indicated mice. n = 3–5 mice/group.
-
ELiver tissue was obtained from the indicated mice and then examined using transmission electron microscopy (Arrowheads indicate mitochondria). Scale bars are 1 μm and 5 μm. n = 4 biological replicates.
-
FSerum ALT and AST levels were measured in 8‐week‐old PPARα−/− mice that were fed a HID with or without Gpx4‐AAV treatment; n = 8 mice/group.
-
G, IHepatic MDA content (G), hepatic iron content (H), hepatic Ptgs2 mRNA levels (I) were measured in the indicated mice; n = 8 mice/group.
-
JMeasurement of intracellular ROS levels by fluorescent probe DCFH‐DA, and the fluorescence intensity of ROS was calculated. All scale bars are 20 μm. n = 3 biological replicates.
-
KKaplan–Meier curves with univariate analysis of overall survival based on the Gpx4‐AAV treatment. n = 5–9 mice/group.
Data information: Data are presented as means ± SD. *P < 0.05, **P < 0.01, ***P < 0.001, determined by ANOVA.
