-
A
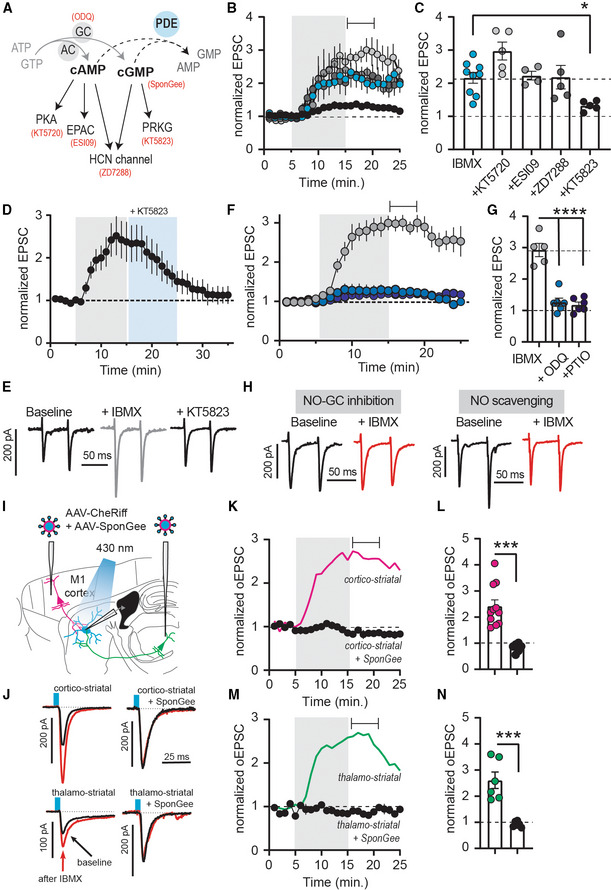
Inhibition of PDE1 decreases both cAMP and cGMP hydrolysis and potentially activate downstream signaling via PKA, EPAC, PRKG, or HCN channels. In red are respective inhibitors or scavengers.
-
B
EPSCs with downstream inhibitors (see A and C) before and after IBMX (75 μM; gray shading). Mean ± SEM. Drugs were used at following concentrations: KT5720 0.5 μM, ESI09 15 μM, ZD7288 30 μM, KT5823 1 μM.
-
C
Averaged responses from the time window indicated in (B). *
P < 0.05, ANOVA followed by Dunnett's multiple comparison test versus IBMX,
N = 4–7. Mean ± SEM. IBMX data in (B) and (C) are replotted from Fig
1.
-
D
EPSCs with bath application of IBMX (75 μM), followed by PRKG inhibitor KT5823 (1 μM). Mean ± SEM. N = 7.
-
E
Example traces from (D).
-
F
EPSCs before and after IBMX (75 μM, gray shading), with either short (10 min, “IBMX”, gray) or long incubation (> 60 min) in NO‐GC inhibitor ODQ (10 μM, light blue), or long incubation in NO‐scavenger carboxy‐PTIO (> 60 min, 50 μM, dark blue). Mean ± SEM.
-
G
Averaged responses for the time window indicated in (F). ****P < 0.05, ANOVA followed by Dunnett's multiple comparison test versus IBMX, N = 5–6. Mean ± SEM.
-
H
Example traces from (F).
-
I
Neurons in M1 or the PF co‐expressed CheRiff and the cGMP scavenger SponGee.
-
J
Example recordings before (
black) and after (
red) IBMX, controls from Fig
1.
-
K
Effect of IBMX on cortico‐striatal oEPSCs in the presence of SponGee (
black). Control oEPSCs are replotted from Fig
1 (
magenta). Mean ± SEM.
-
L
Corticostriatal oEPSCs averaged from the time indicated in (F). ***P < 0.001, unpaired t‐test, N = 11 and 6. Mean ± SEM.
-
M, N
As (J, K) but thalamostriatal oEPSCs. Controls (
green) are replotted from Fig
1. ***
P < 0.001, unpaired
t‐test,
N = 6 and 6. Mean ± SEM.

