-
A
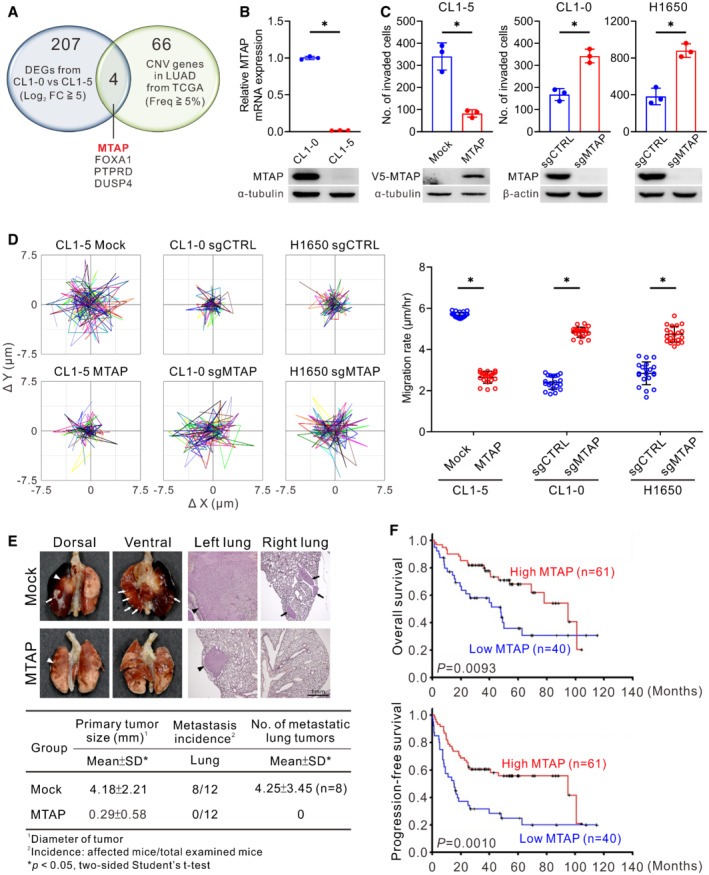
The Venn diagram showing 207 differentially expressed genes (DEGs) between CL1‐0 and CL1‐5 cells (fold change greater than 5‐fold in Log2 scale) and 66 genes with copy number variation (CNV, Frequency ≧5%) in lung adenocarcinoma (LUAD) from TCGA database (PanCancer Atlas) and the 4 intersected genes.
-
B
Comparisons of MTAP mRNA and protein expression between CL1‐0 and CL1‐5 cells detected by RT‐qPCR (top, mean ± SD, Student t test, n = 3, biological replicates, *P < 0.05) and Western blot assays using anti‐MTAP antibody (bottom, representative of three independent experiments).
-
C
Cell invasion abilities of MTAP‐overexpressing CL1‐5 or MTAP‐knockout CL1‐0 and H1650 were determined by Boyden chamber invasion assays (mean ± SD, Student t test, n = 3, biological replicates, *P < 0.05). sgCTRL indicates cells transduced with a nontargeting control sgRNA, and sgMTAP indicates cells transduced with a sgRNA targeting MTAP. Bottom: the protein expression levels of V5‐MTAP and endogenous MTAP were detected by Western blots.
-
D
Migration assays using a single‐cell tracking, time‐lapse video microscopy system. Representative trajectories and quantification of averaged velocity of cells (mean ± SD, Student t test, n = 20, technical replicates, *P < 0.05). Data shown are representative of three independent experiments.
-
E
Effect of MTAP overexpression on lung cancer metastasis in vivo was demonstrated by orthotopic implantation assays. Top: representative photographs of lungs and H&E staining of the lung sections. The primary tumors are indicated by arrowheads and the metastatic nodules are indicated by arrows. Bottom: quantification of averaged primary tumor sizes, metastatic incidence and nodule number.
-
F
Kaplan–Meier analyses of overall survival (top) and progression‐free survival (bottom) for 101 patients with lung adenocarcinoma grouped into high‐ or low‐MTAP mRNA expression measured by RT‐qPCR. P values were obtained by log‐rank test.

