-
A
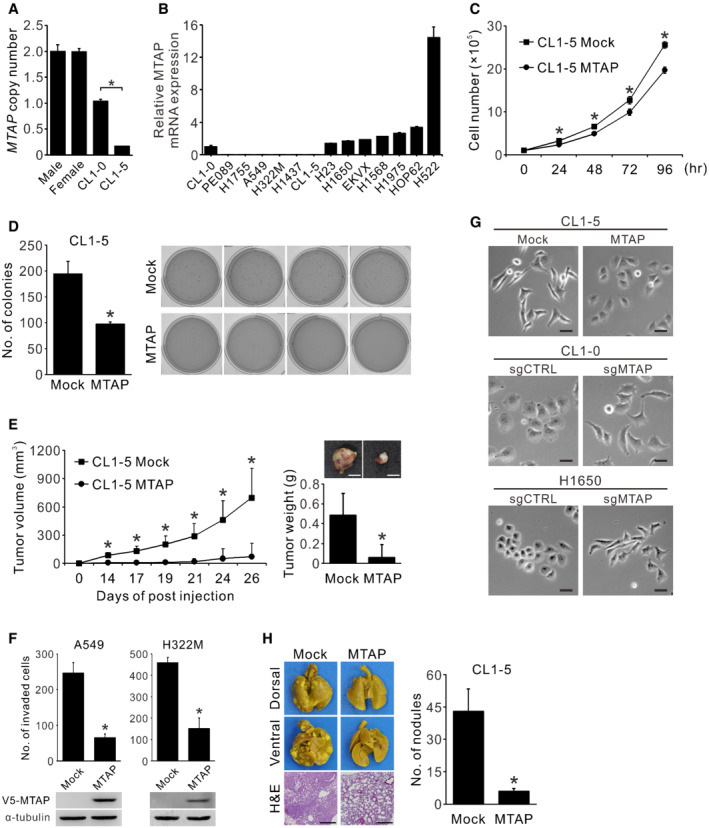
Comparison of MTAP DNA copy number between PBMCs from healthy donors, CL1‐0, and CL1‐5 cells detected by real‐time genomic PCR (mean ± SD, Student t test, n = 3, biological replicates, *P < 0.05). Ribonuclease P (RNaseP) served as the internal control.
-
B
Relative mRNA expression of MTAP was detected in 14 lung cancer cell lines assayed by RT‐qPCR (mean ± SD, n = 3, biological replicates). TATA‐binding protein (TBP) served as the internal control.
-
C
Effect of MTAP on cell proliferation was determined by cell collection and counting at indicated time points (mean ± SD, Student t test, n = 3, technical replicates, *P < 0.05). Data shown are representative of three independent experiments.
-
D
Effect of MTAP on anchorage‐independent colony formation. Left: quantification of colonies stained by crystal violet and counted under phase microscopy (mean ± SD, Student t test, n = 4, biological replicates, *P < 0.05). Right: images of anchorage‐independent colony formation assays of CL1‐5 Mock control and MTAP‐overexpressing cells.
-
E
CL1‐5 Mock and MTAP‐overexpressing transfectants were subcutaneously injected into the NOD/SCID mice to determine the tumorigenesis ability. Left: the tumor volumes measured at indicated days (mean ± SD, Student t test, n = 8, biological replicates, *P < 0.05). Right: representative images of tumors and the tumor weights measured at 27 days postinjection (mean ± SD, Student t test, n = 8, biological replicates, *P < 0.05). Scale bar, 5 mm.
-
F
Cell invasion abilities of MTAP‐overexpressing A549 and H322M were determined by Matrigel invasion assays (mean ± SD, Student t test, n = 3, biological replicates, *P < 0.05). Bottom: the protein expression levels of V5‐MTAP were detected by Western blots.
-
G
Effect of MTAP expression on cell morphology. Cells were examined by a phase contrast microscope. Scale bar, 50 μm. Data shown are representative of three independent experiments.
-
H
Micrometastatic analysis of MTAP‐overexpressing cells. NOD/SCID mice were intravenously injected with CL1‐5 Mock control and MTAP‐overexpressing cells, and sacrificed at 10 weeks post injection. Left: the appearances and the representative hematoxylin and eosin (H&E) staining of the lung sections from mice injected with CL1‐5 Mock and MTAP transfectants. Scale bar, 50 μm. Right: the gross pulmonary metastasis nodules were quantified under dissecting microscope (Mock, n = 11; MTAP, n = 9; biological replicates, mean ± SE, Student t test, *P < 0.05).

