-
A
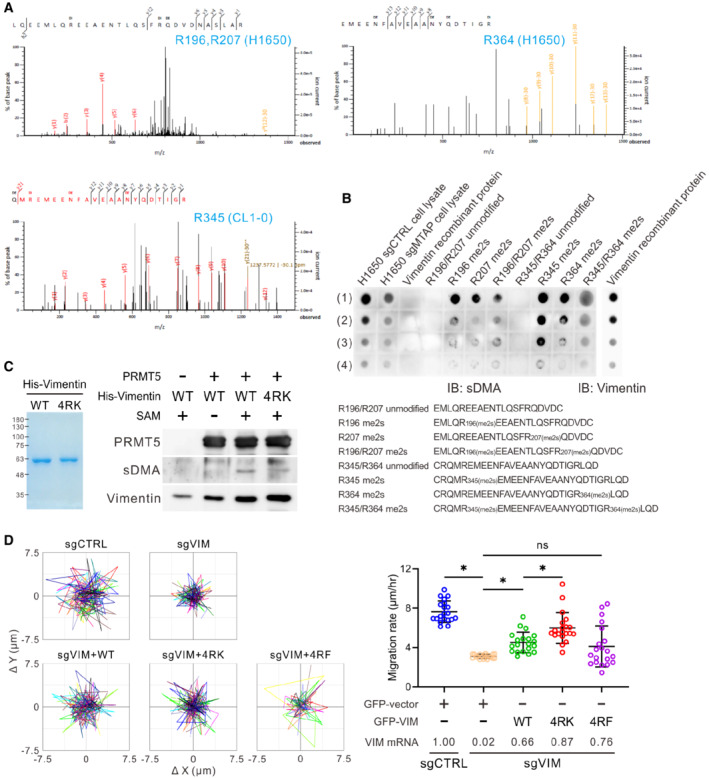
MS/MS spectra evidence of sDMA at R196, R207, and R364 from H1650 vimentin and R345 from CL1‐0 vimentin.
-
B
Dot blot analysis showing specificity of sDMA antibody. H1650 cell lysates were used as positive controls. The sequences of non‐methylated (unmodified) and dimethylated (me2s) vimentin peptides were shown in the bottom. H1650 cell lysates: (1) 6.5 μg, (2) 3.2 μg, (3) 1.6 μg, (4) 0.8 μg. Vimentin recombinant protein: (1) 0.5 μg, (2) 0.25 μg, (3) 0.125 μg, (4) 0.0625 μg. Vimentin peptides: (1) 5 μg, (2) 2.5 μg, (3) 1.25 μg, (4) 0.625 μg.
-
C
In vitro methyltransferase assays of vimentin wild‐type and 4RK mutant by PRMT5 analyzed by Western blots with anti‐sDMA antibody (right). Left: purified His‐vimentin proteins were stored in methylation reaction buffer, fractionated by SDS‐PAGE, and visualized by Coomassie blue stain. Data shown are representative of two independent experiments.
-
D
Single‐cell tracking migration assays. CL1‐5 control and vimentin‐knockout cells were transfected with GFP vector or GFP‐vimentin for 48 h. Cells expressing GFP fluorescence were tracked by the time‐lapse video microscopy system. Representative trajectories and quantification of averaged velocity of cells (mean ± SD, Student t test, n = 20, technical replicates, *P < 0.05). 4RK indicates R196/207/345/364K; 4RF indicates R196/207/345/364F. Data shown are representative of three independent experiments.

