-
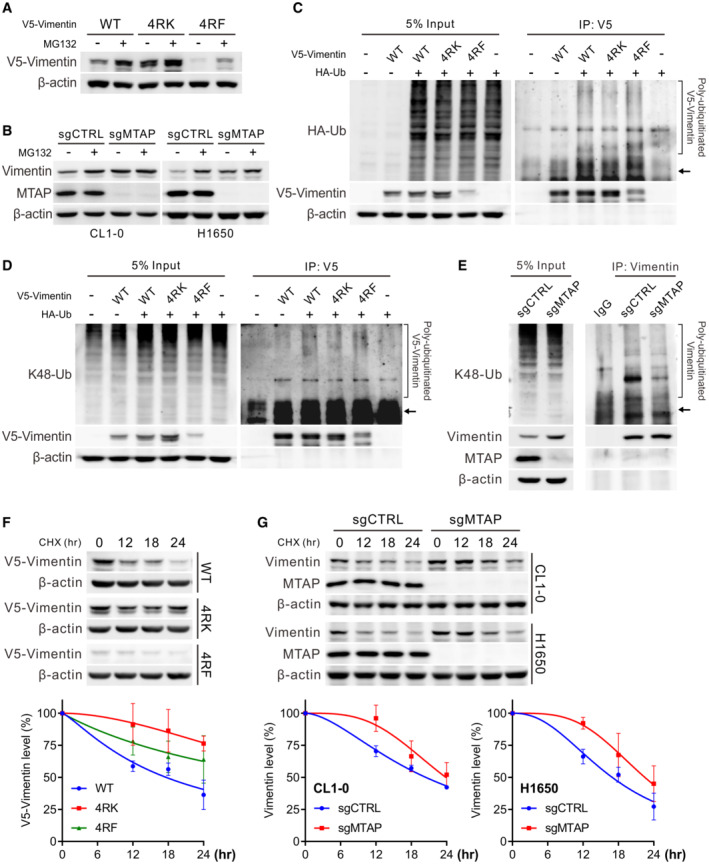
A
Measurement of V5‐vimentin wild‐type, 4RK and 4RF mutant protein levels in CL1‐5 vimentin‐knockout cells treated with 10 μM MG132 by Western blots. Data shown are representative of three independent experiments.
-
B
Western blot analysis of vimentin protein levels in control and MTAP‐knockout cells treated with 10 μM of MG132. Data shown are representative of three independent experiments.
-
C, D
Immunoprecipitation analysis of ubiquitination (C) and K48‐linked polyubiquitination (D) of V5‐vimentin in HEK293T cells transfected with wild‐type, 4RK‐ or 4RF‐mutated vimentin in the presence of HA‐tagged ubiquitin. Arrows mark the sites of V5‐vimentin. Data shown are representative of three independent experiments.
-
E
Immunoprecipitation analysis for K48‐linked polyubiquitination of vimentin in CL1‐0 control and MTAP‐knockout cells. Arrow marks the site of vimentin. Data shown are representative of three independent experiments.
-
F, G
Western blot analysis of V5‐vimentin wild‐type, 4RK and 4RF mutant levels in CL1‐0 cells (F) or endogenous vimentin levels in control and MTAP‐knockout cells (G) treated with 50 μg/ml cycloheximide (CHX). Bottom: the intensity of V5‐vimentin and vimentin signals was quantified by ImageJ software, normalized to the internal control β‐actin, then normalized to zero time point, and plotted against time points (mean ± SE, n = 3, biological replicates).