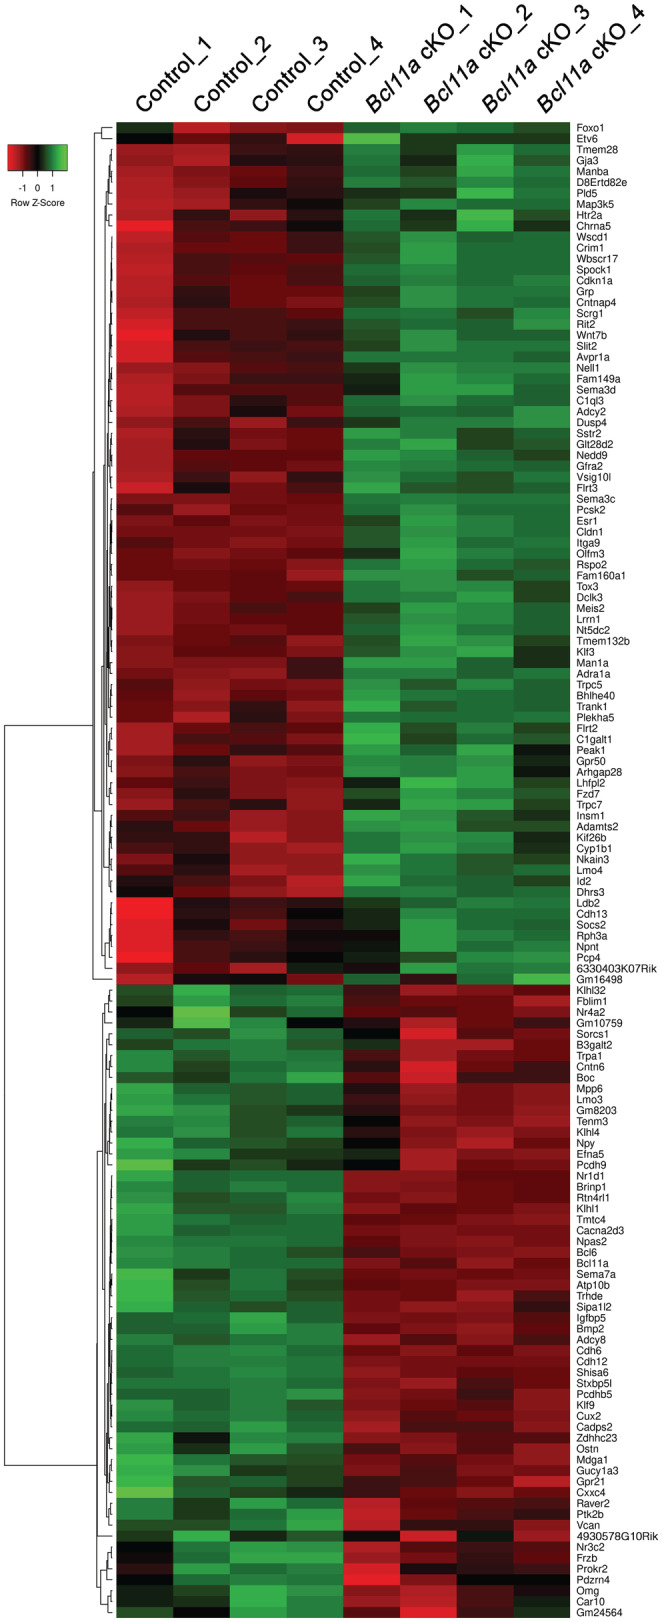
Figure EV1. Heat map of differentially expressed genes in upper layers of P2 Bcl11a F/F ;Emx1 IRESCre compared with control neocortex.

Heat map showing 79 upregulated genes (green) and 58 downregulated genes (red) in upper neocortical layers of conditional Emx1 IRESCre ;Bcl11a F/F mutants (Bcl11a cKO) compared with controls at postnatal day 2.
