-
A
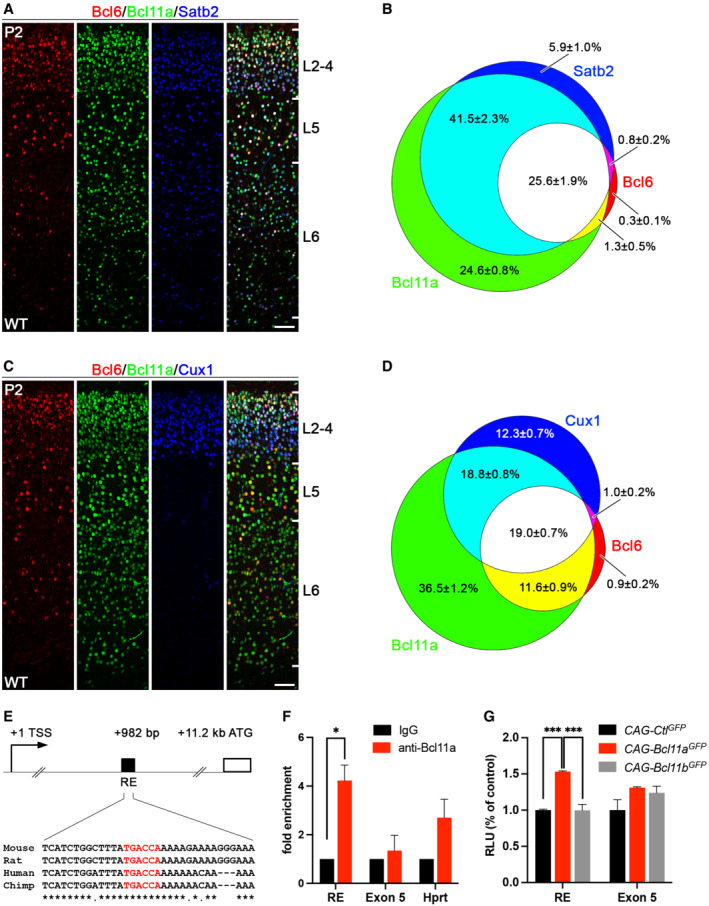
Immunohistochemistry of Bcl6 (red), Bcl11a (green), and Satb2 (blue) in P2 wild‐type neocortex.
-
B
Venn diagram displaying the proportions of Bcl6 neurons overlapping with Bcl11a and Satb2 expressing cells. The percentage of each labeled cell population is given in relation to all labeled cells (Bcl6+ and Bcl11a+ and Satb2+, in total 4,479 cells).
-
C
Immunohistochemistry of Bcl6 (red), Bcl11a (green), and Cux1 (blue) in P2 wild‐type neocortex.
-
D
Venn diagram displaying the proportions of Bcl6 neurons overlapping with Bcl11a and Cux1 expressing cells. The percentage of each labeled cell population is given in relation to all labeled cells (Bcl6+ and Bcl11a+ and Cux1+, in total 4,301 cells).
-
E
Scheme of the Bcl6 gene locus displaying the start codon (ATG) at +11.2 kb relative to the transcriptional start site (TSS). A regulatory element (RE) in the first intron at +982 bp contains a conserved binding motif (TGACCA, in red) of Bcl11a.
-
F
ChIP analysis using a Bcl11a antibody and P2 cortical tissue detects Bcl11a binding to the RE shown in (E). Negative controls include ChIP with unspecific IgG antibody and the precipitation of exon 5 of Bcl6 and the Hprt promoter. The experiment was independently repeated four times. Results are expressed as mean ± s.e.m.; Student's t‐test; *P < 0.05.
-
G
Luciferase assays in HEK293 cells transfected with control (CAG‐Ctl
GFP
), Bcl11a (CAG‐Bcl11a
GFP
), or Bcl11b (CAG‐Bcl11b
GFP
) expression vector show induction of luciferase activity of the RE reporter construct by Bcl11a. Negative controls include a reporter construct for a region of exon 5 of the Bcl6 gene and co‐transfection with the closely related transcription factor Bcl11b. The experiment was independently repeated four times. Results are expressed as mean ± s.e.m.; one‐way ANOVA followed by Tukey's post‐hoc test; ***P < 0.001. Data information: Scale bars, 50 μm.

