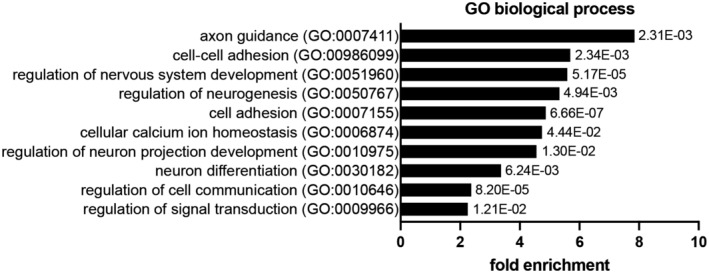
Figure EV2. Gene ontology enrichment analysis of differentially expressed genes in upper layers of P2 Bcl11a F/F ;Emx1 IRESCre compared with control neocortex.

Graph shows selected GO terms for biological process, GO term accession numbers, fold enrichment, and P‐value. Data were obtained by GO overrepresentation test using PANTHER.
