
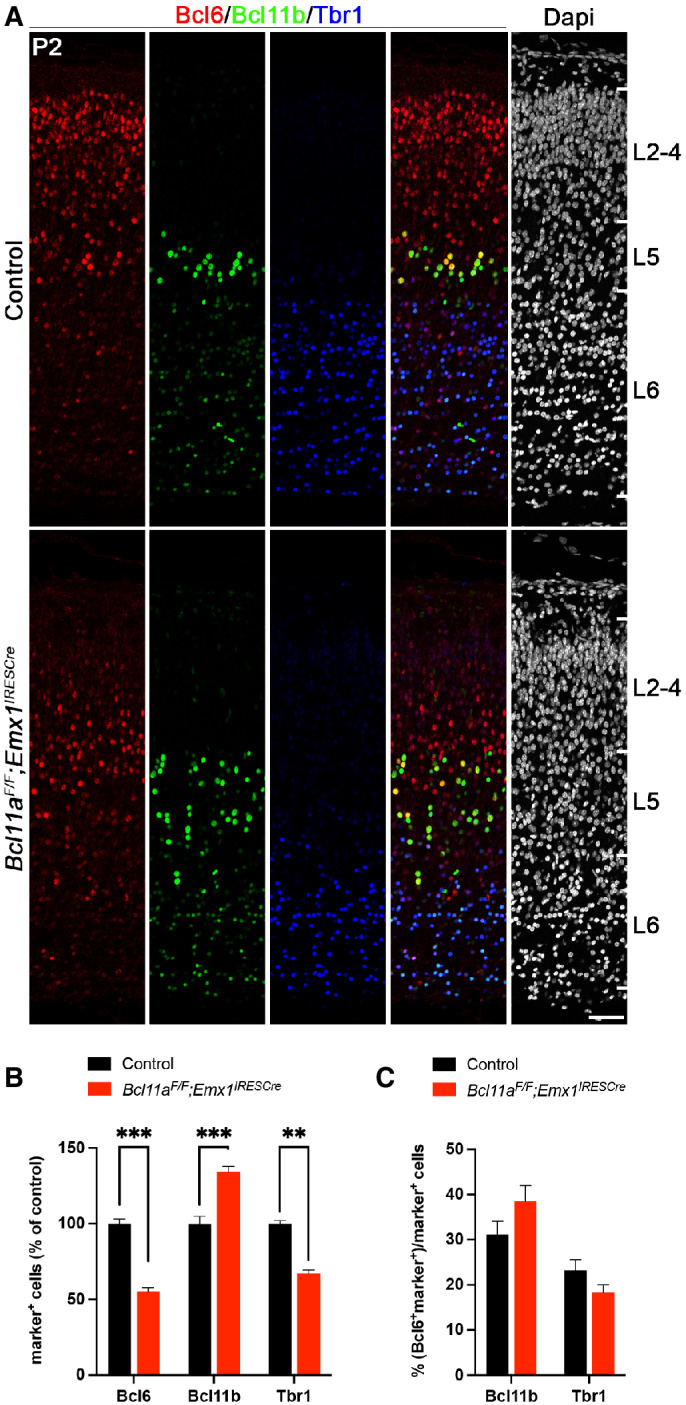
Figure EV4. Relative Bcl6 expression is unchanged in deep cortical layers of Bcl11a F/F ;Emx1 IRESCre compared with control neocortex.
-
AImmunohistochemistry of Bcl6 (red), Bcl11b (green), and Tbr1 (blue) in P2 Bcl11a F/F ;Emx1 IRESCre and control neocortex. Bcl6 and Tbr1 expressions are downregulated, while Bcl11b expression is upregulated in Bcl11a F/F ;Emx1 IRESCre compared with control neocortex. Nuclei are stained with Dapi (white).
-
BRelative quantification of Bcl6+, Bcl11b+, and Tbr1+ cells in Bcl11a F/F ;Emx1 IRESCre and control neocortex (n = 4).
-
CNumbers of Bcl11b+ or Tbr1+ cells that coexpress Bcl6 are normal in Bcl11a F/F ;Emx1 IRESCre compared with control neocortex (n = 4).
Data information: All graphs represent mean ± s.e.m.; Student's t‐test; **P < 0.01; ***P < 0.001. Scale bar, 50 μm.