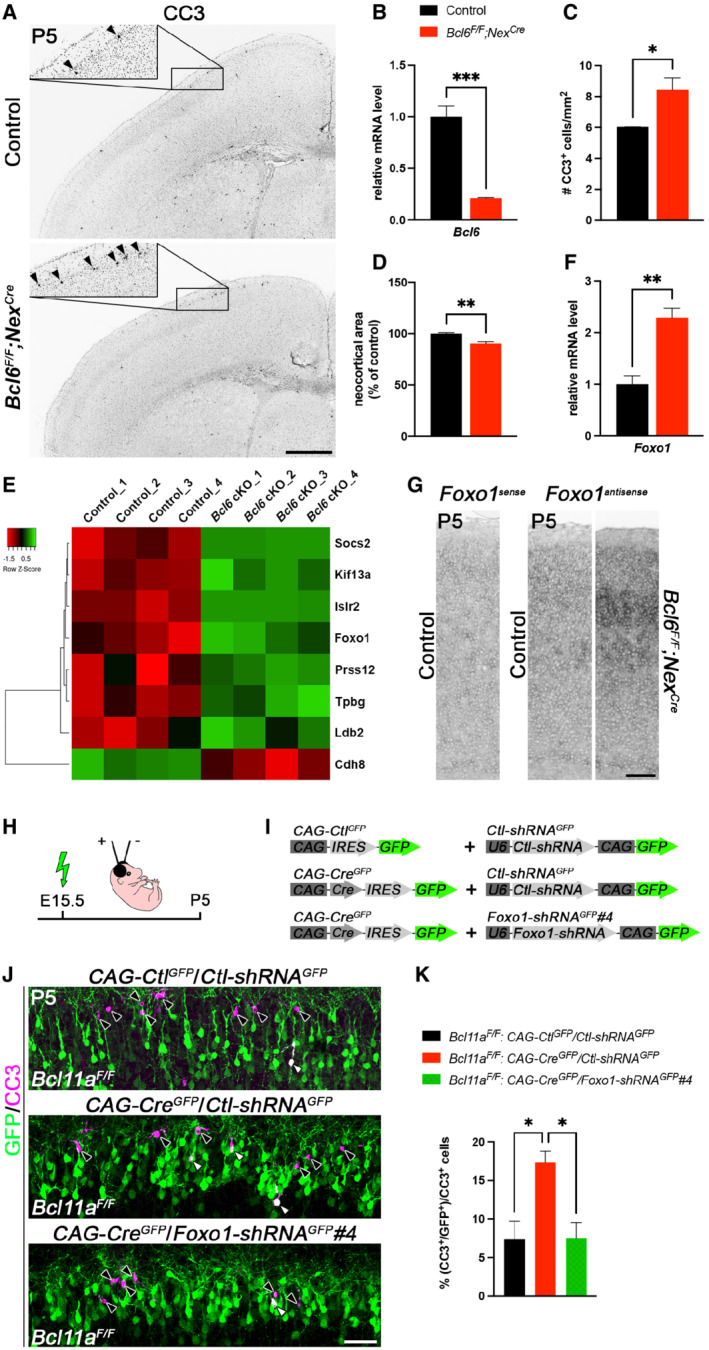
Figure 5. Postnatal developmental cell death is increased in Bcl6 F/F ;Nex Cre neocortex.

-
AImmunohistochemistry of cleaved caspase 3 (CC3) shows that the number of CC3+ cells (marked by black arrowheads) is increased in P5 Bcl6 F/F ;Nex Cre compared with control neocortex. Insets are enlargements of the boxed areas in corresponding panels.
-
BRelative Bcl6 mRNA expression level determined by quantitative real‐time PCR using primers targeting a region of exon 8 is decreased in P0 Bcl6 F/F ;Nex Cre compared with control brains (n = 4). Results are expressed as mean ± s.e.m.; Student's t‐test; ***P < 0.001.
-
CQuantification of the experiment shown in (A) (n = 3). Results are expressed as mean ± s.e.m.; Student's t‐test; *P < 0.05.
-
DQuantification of neocortical area in P5 Bcl6 F/F ;Nex Cre and control brains (n = 3). Results are expressed as mean ± s.e.m.; Student's t‐test; **P < 0.01.
-
EHeat map showing differentially expressed genes in laser‐microdissected superficial cortical layers of P5 Bcl6 F/F ;Nex Cre compared with control brains (n = 4).
-
FRelative Foxo1 mRNA expression level determined by quantitative real‐time PCR is increased in laser‐microdissected superficial cortical layers of P5 Bcl6 F/F ;Nex Cre compared with control brains (n = 4). Results are expressed as mean ± s.e.m.; Student's t‐test; **P < 0.01.
-
GRNA in situ hybridization showing upregulation of Foxo1 expression in P5 Bcl6 F/F ;Nex Cre compared with control neocortex.
-
HSchematic representation of the experimental approach. Embryos are electroporated at E15.5 and sacrificed at P5.
-
IDNA plasmids used in the experiment shown in (J and K).
-
JImmunohistochemistry of electroporated P5 Bcl11a F/F neurons in superficial cortical layers with GFP (green) and cleaved caspase 3 (CC3, magenta) antibodies. Electroporation of CAG‐Cre GFP plasmid together with Foxo1‐shRNA GFP #4 into Bcl11a F/F neocortex reduces the number of CC3+ cells to control levels. White and black arrowheads indicate GFP+ CC3+ and GFP+ cells, respectively.
-
KQuantification of the experiment shown in (J) (n = 4, CAG‐Ctl GFP /Ctl‐shRNA GFP ; n = 3, CAG‐Cre GFP /Ctl‐shRNA GFP ; n = 5, CAG‐Cre GFP /Foxo1‐shRNA GFP #4). Results are expressed as mean ± s.e.m.; one‐way ANOVA followed by Tukey's post‐hoc test; *P < 0.05.
Data information: Scale bars, 500 μm (A), 50 μm (G, J).
