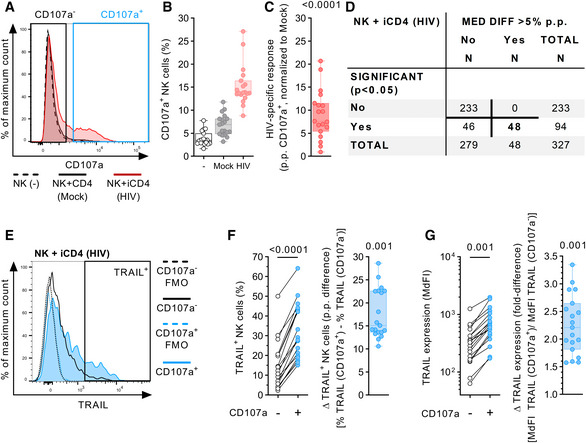
Figure 1. NK cell degranulation is associated with increased TRAIL surface expression after co‐incubation with autologous HIV‐1‐infected CD4 T cells.

- Representative histograms (overlay) displaying CD107a expression on NK cells after culture with the described culture conditions (NK(−), Mock, HIV). For the HIV‐1 co‐culture condition, subsequent analyses of antigen expression were conducted by gating non‐responsive (CD107a−) and responsive (CD107a+) NK cell subsets.
- Relative frequency of CD107a+ NK cells (y‐axis) after culture in the described conditions (x‐axis) (n = 19 different donors).
- HIV‐specific response of bulk NK cells displayed as percentage points (p.p.) CD107a+ NK cells after normalization to mock CD4 T cells (y‐axis) (n = 19 different donors).
- Summary table showing numeric results of the 327 surface antigens analyzed. A total of 48 surface molecules showed statistically significant intra‐donor differences > 5 p.p. in expression between CD107a+ and CD107a− NK cells after exposure to HIV‐1‐infected CD4 T cells (HIV).
- Representative histograms (overlay) showing TRAIL surface expression as fluorescence intensity on NK cells after co‐incubation with HIV‐1‐infected CD4 T cells. Histograms show TRAIL expression for CD107a+ and CD107a− NK cell subsets (solid lines) as well as their corresponding FMO controls (dotted lines). Gate defining TRAIL+ cells is indicated as well.
- Left panel: Relative frequency of TRAIL+ cells (y‐axis) of CD107a+ and CD107a− NK cell subsets (x‐axis) after co‐incubation with HIV‐1‐infected CD4 T cells. Right panel: Difference in relative frequency of TRAIL+ cells (y‐axis) between CD107a+ and CD107a− cells displayed as p.p. (n = 19 different donors).
- Left panel: TRAIL surface expression (y‐axis) of CD107a+ and CD107a− NK cell subsets (x‐axis) after co‐incubation with HIV‐1‐infected CD4 T cells displayed as median fluorescence intensity. Right panel: Differences in TRAIL surface expression (y‐axis) between CD107a+ and CD107a− cells displayed as fold difference (n = 19 different donors).
Source data are available online for this figure.
