
Figure EV1. DcR1 is expressed on CD4 T cells.
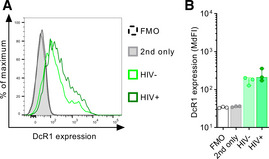
Primary enriched CD4 T cells were stimulated for 3 days and then infected with the HIV strain NL4‐3. Four days post‐infection cells were labeled with LIVE/DEAD Fixable Near‐IR Stain, followed by incubation with αCD4‐APC, αp24‐FITC, goat anti‐human DcR1, and then labeled with anti‐goat‐PE. Expression was measured as median fluorescence intensity (MdFI) by flow cytometry.
- Representative flow cytometry histogram of DcR1 expression on uninfected (HIV−: CD4+/p24−) and infected (HIV+: CD4−/p24+) cells in comparison to the anti‐goat‐PE control (grey) or FMO control (dashed line).
- Cumulative data of DcR1 expression displayed as MdFI. Data points represent the mean of two technical replicates per condition of three different donors (n = 3). Bar graphs show the median. Error bars show the IQR.
Source data are available online for this figure.