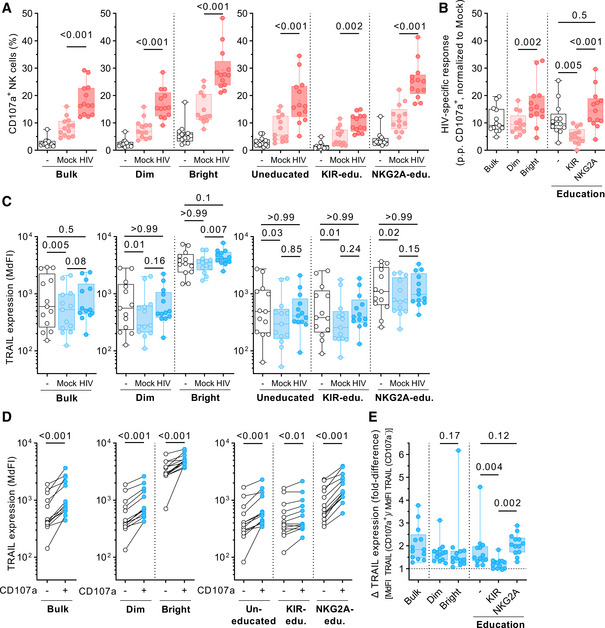
Figure 2. NK cell degranulation is associated with increased TRAIL expression across multiple NK cell subsets.

- Relative frequency of CD107a+ cells (y‐axis) of predefined NK cell subsets (x‐axis). Left panel displays data for bulk NK cells, middle panel for CD56Dim and CD56Bright NK cells, right panel for uneducated, KIR‐educated, and NKG2A‐educated cells (n = 13 different donors).
- HIV‐specific responses of predefined NK cell sub‐populations (x‐axis) displayed as percentage points (p.p.) CD107a+ NK cells after normalization to mock CD4 T cells (y‐axis) (n = 13 different donors).
- TRAIL expression levels (y‐axis) of predefined NK cell subsets (x‐axis). Left panel displays data for bulk NK cells, middle panel for CD56Dim and CD56Bright NK cells, and right panel for uneducated, KIR‐educated, and NKG2A‐educated cells. Expression is displayed as median fluorescence intensity (MdFI) (n = 13 different donors).
- Comparison of TRAIL expression levels (y‐axis) between CD107a− and CD107a+ cells of predefined NK cell subsets. Left panel displays data for bulk NK cells, middle panel for CD56Dim and CD56Bright NK cells, right panel for uneducated, KIR‐educated, and NKG2A‐educated cells. Expression is displayed as MdFI (n = 13 different donors).
- Fold differences in TRAIL surface expression (y‐axis) between CD107a+ and CD107a− cells of predefined NK cell sub‐populations (x‐axis) (n = 13 different donors).
Source data are available online for this figure.
