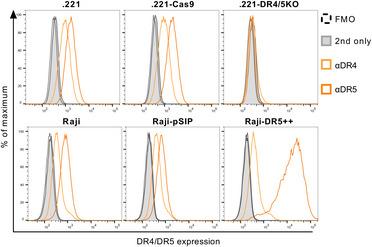
Figure EV2. Expression of TRAIL receptors on transduced 721.221 and Raji cells.

The expression of DR4 and DR5 was assessed by flow cytometry. 721.221 and Raji cells were labeled with LIVE/DEAD Fixable Near‐IR Stain, followed by incubation with biotin‐conjugated mouse anti‐human DR4 or DR5, and then labeled with Streptavidin‐BV421. Expression was quantified as fluorescence intensity. Representative histogram of DR4 (light orange) and DR5 (dark orange) expression in comparison to the Streptavidin‐only control (grey) or the FMO control (dashed line). Upper panel (from left to right): untransduced 721.221 cells, Cas9‐transduced .221s, and DR4/5 double knockout .221s. Lower panel (from left to right): untransduced Raji cells, Raji cells transduced with an empty vector (pSIP), and Raji cells overexpressing DR5.
