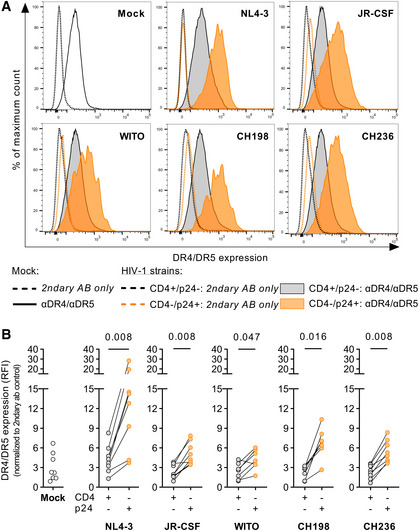
Figure 3. In vitro HIV‐1‐infected CD4 T cells display increased surface expression of the TRAIL receptors DR4/5.

- Histograms (overlay) of one representative donor displaying combined DR4/5 surface expression on CD4 T cells previously incubated with NL4‐3, JR‐CSF, WITO, CH198, or CH236. Expression is displayed as fluorescence intensity (x‐axis).
- Comparison of the combined surface expression of DR4/5 between mock (white circles), uninfected (grey circles), and infected CD4 T cells (orange circles), from left to right: Mock: n = 8; NL4‐3: n = 8; JR‐CSF: n = 8; WITO: n = 7; CH198: n = 7; CH236: n = 8 (7–8 different donors per condition). Expression is displayed as relative fluorescence intensity (RFI) after normalization to the respective secondary AB‐only control (y‐axis).
Source data are available online for this figure.
