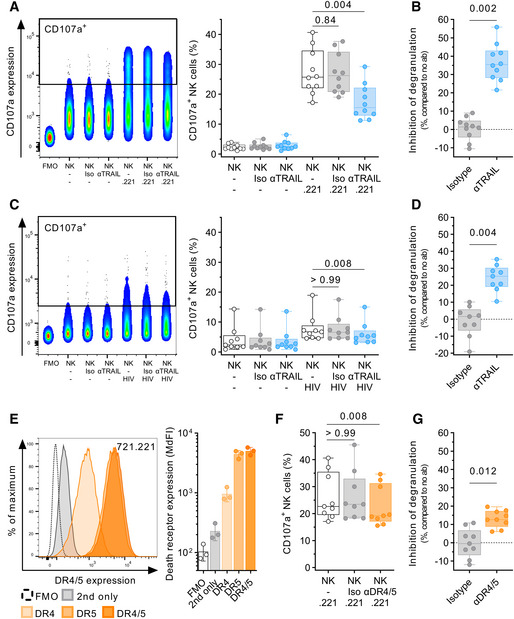
Figure 4. Antibody‐mediated blocking of TRAIL inhibits NK cell degranulation.

- Comparison of CD107a expression after co‐culture with 721.221 target cells with either 10 µg/ml αTRAIL or isotype control (Iso) using flow cytometry (n = 10 different donors per condition). Each data point represents the mean of two technical replicates. Effector:target ratio was 1:1. Left panel: Concatenated density plot depicting CD107a expression as fluorescence intensity for one representative donor. Right panel: Box plots showing relative frequency of CD107a+ NK cells (y‐axis).
- Box plots display inhibition of degranulation (y‐axis) after co‐culture with 721.221 target cells in presence of either isotype or αTRAIL as relative reduction compared to no antibody (n = 10 different donors per condition).
- Comparison of CD107a expression after co‐culture with autologous HIV‐I‐infected CD4 T cells with either 10 µg/ml αTRAIL or isotype control (Iso) using flow cytometry (n = 9 different donors per condition). Each data point represents the mean of two technical replicates. Left panel: Concatenated density plot depicting CD107a expression as fluorescence intensity for one representative donor. Right panel: Box plots showing relative frequency of CD107a+ NK cells (y‐axis).
- Box plots display inhibition of degranulation (y‐axis) after co‐culture with autologous HIV‐I‐infected CD4 T cells in the presence of either isotype or αTRAIL as relative reduction compared to no antibody (n = 9 different donors per condition).
- Representative histograms (overlay, left panel) and bar graphs (n = 3 independent experiments, right panel) showing the individual and combined surface expression of DR4 and DR5 on 721.221 cells. Each data point represents the mean of three technical replicates.
- Comparison of CD107a expression after co‐culture with 721.221 target cells in the presence of either αDR4/5 (10 µg/ml each) or 20 µg/ml isotype control (Iso) using flow cytometry (n = 9 different donors per condition). Effector:target ratio was 1:1. Box plots showing relative frequency of CD107a+ NK cells (y‐axis).
- Box plots display inhibition of degranulation after co‐culture with 721.221 target cells in the presence of either isotype or αDR4/5 as relative reduction compared to no antibody (n = 9 different donors per condition).
Source data are available online for this figure.
