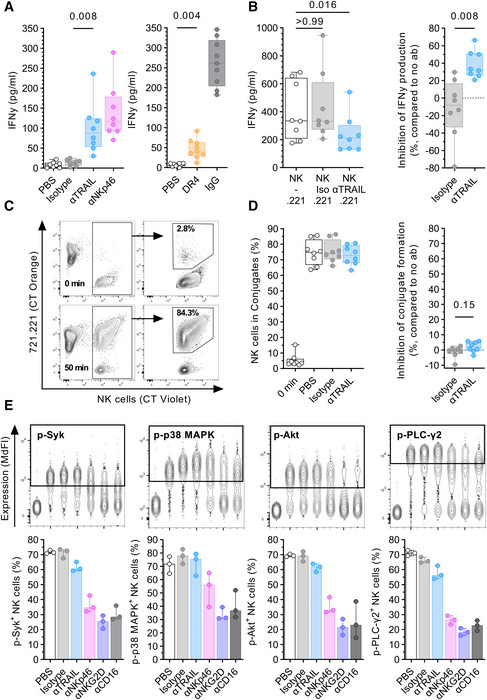
Figure 6. TRAIL engagement induces Interferon γ production but does not promote cell adhesion.

- Comparison of IFNγ production (y‐axis) after incubation with plate‐coated antibodies or proteins (10 µg/ml each) (x‐axis). Box plots showing IFNγ concentration in the supernatant as determined by ELISA (left panel: n = 8 different donors per condition, right panel: n = 9 different donors per condition).
- Comparison of IFNγ levels in the supernatant after co‐culture of NK cells with 721.221 target cells in the presence or absence of either 10 µg/ml αTRAIL or isotype control (Iso) using ELISA (n = 8 different donors per condition). Effector:target ratio was 1:1. Left panel: Box plots showing IFNγ levels (y‐axis) for the described culture conditions (x‐axis). Right panel: Box plots display inhibition of IFNγ production by NK cells (y‐axis) in presence of either isotype or αTRAIL as relative reduction compared to no antibody.
- Representative contour plots showing conjugate formation between NK cells and 721.221 target cells as determined by flow cytometry. Plots showing three distinct populations at the beginning of the co‐culture (0 min) and after 50 min: single 721.221 cells (CT Orange positive), single NK cells (CT Violet positive), and conjugates (double positive). Relative frequency of NK cells in conjugates is calculated based on the total number of gated NK cells.
- Comparison of conjugate formation after co‐culture between NK cells and 722.221 cells after 0 min and after 50 min in the presence or absence of 10 µg/ml αTRAIL or isotype control (n = 8 different donors). Left panel: Box plots showing relative frequency of NK cells in conjugates (y‐axis) for different time points and conditions (x‐axis). Right panel: Box plots display inhibition of conjugate formation (y‐axis) in the presence of either isotype or αTRAIL as relative reduction compared to no antibody.
- Expression levels of phosphorylated signaling proteins. Upper panel: Concatenated contour plots of one donor depicting the expression of phosphorylated signaling proteins Syk, p38 MAPK, Akt, and PLC‐γ2 for the following culture conditions and controls (x‐axis: left to right): FMO, PBS, isotype, αTRAIL, αNKp46, αNKG2D, and αCD16. Lower panel: Bar graphs showing the percentage of p‐Syk+, p‐p38 MAPK+, p‐Akt+, and p‐PLC‐γ2+ NK cells after 30 min of stimulation (n = 3 different donors). Bar graphs represent the median, whiskers display minimum and maximum data points.
Data information: Wilcoxon signed‐rank test. (A, B, D) Samples were acquired in duplicate and the mean was calculated for each donor and condition. Box plots represent the median and 25%/75% percentile. Whiskers indicate minimum and maximum data points.
Source data are available online for this figure.
