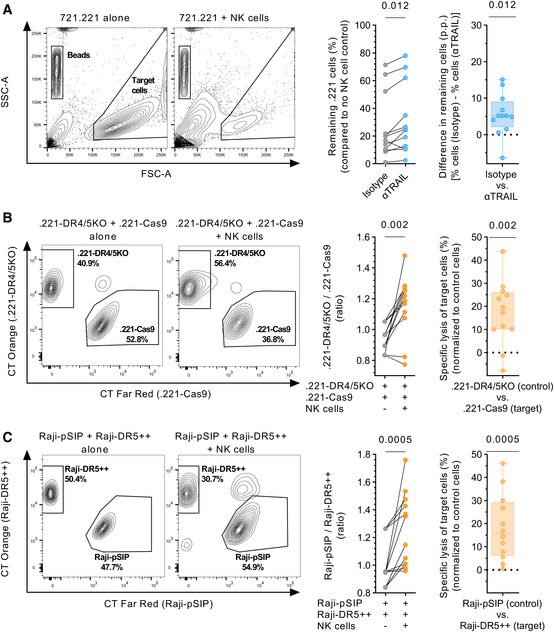
Figure 7. TRAIL contributes to NK‐cell‐mediated killing of target cells.

- Left panel: Representative contour plots showing depletion of 721.221 target cells in the presence of NK cells. Middle panel: Percentage of target cells remaining (y‐axis) after co‐culture with NK cells in the presence of either αTRAIL or isotype control, in reference to target cells kept alone. Right panel: Box plots displaying difference in target cells remaining (y‐axis) between αTRAIL and isotype conditions displayed as p.p. (n = 12 different donors). Each data point represents the mean of at least two technical replicates.
- Left panel: Representative contour plots showing the percentage of .221‐DR4/5KO (control) and .221‐Cas9 cells (target) in the presence or absence of NK cells. Middle panel: Ratio between .221‐DR4/5KO and .221‐Cas9 cells (y‐axis) in the presence or absence of NK cells. Right panel: Specific lysis of .221‐Cas9 cells displayed as percent (n = 12 different donors). Each data point represents the mean of at least three technical replicates.
- Left panel: Representative contour plots showing the percentage of Raji‐pSIP (control) and Raji‐DR5++ (target) in the presence or absence of NK cells. Middle panel: Ratio between Raji‐pSIP and Raji‐DR5++ (y‐axis) in the presence or absence of NK cells. Right panel: Specific lysis of Raji‐DR5++ cells displayed as % (n = 12 different donors). Each data point represents the mean of at least three technical replicates.
Source data are available online for this figure.
