
Figure 3. KIF5A ∆Exon27 relieves motor autoinhibition and displays increased velocity and processivity.
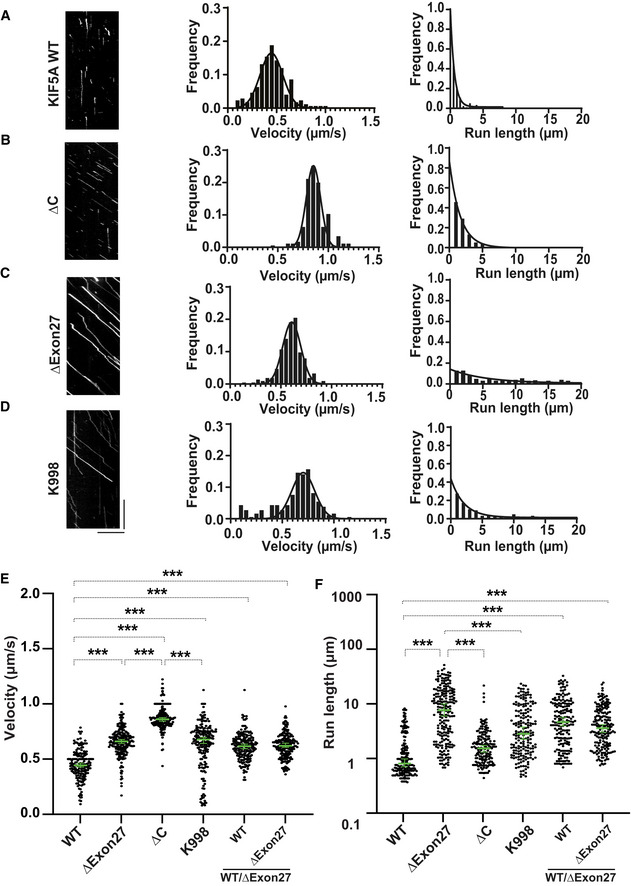
Kymographs and motility analyses of KIF5A motor proteins prepared from HEK293T cells.
-
AKIF5A WT‐GFP. From kymographs (example on the left), single‐motor velocities (middle) and run‐lengths (right) were determined.
-
BAs in (A), but for ∆C‐GFP.
-
CAs in (A), but for ∆Exon27‐GFP.
-
DAs in (A), but for K998‐GFP. The x‐axis scale for the processivity graphs was limited to 20 μm to permit a direct comparison of the run‐lengths of different constructs. Diagonal lines in the kymograph represent KIF5A molecules moving over time. The depicted scale bars shown for all kymographs in this figure are 5 μm (horizontal line) and 10 s (vertical line). The velocity data were fit with Gaussian distribution and the processivity data were fit with an exponential decay function.
-
E, FStatistical analysis of the velocity (E) and processivity (F) of various KIF5A proteins. The green bars represent the median with 95% CI. The statistical comparison of velocity was performed using unpaired parametric t‐test (***P < 0.001). The run‐length is in log scale. The statistical evaluation of processivity was performed using one‐way ANOVA (***P < 0.001). The measured values for the velocities and run‐lengths are listed in Table 1. WT: n = 176; ∆Exon27: n = 215; ∆C: n = 175; K998: n = 185; WT/∆Exon27 (WT): n = 185; WT/∆Exon27 (∆Exon27): n = 193. Three biological replicates. Data represent the mean ± SD.