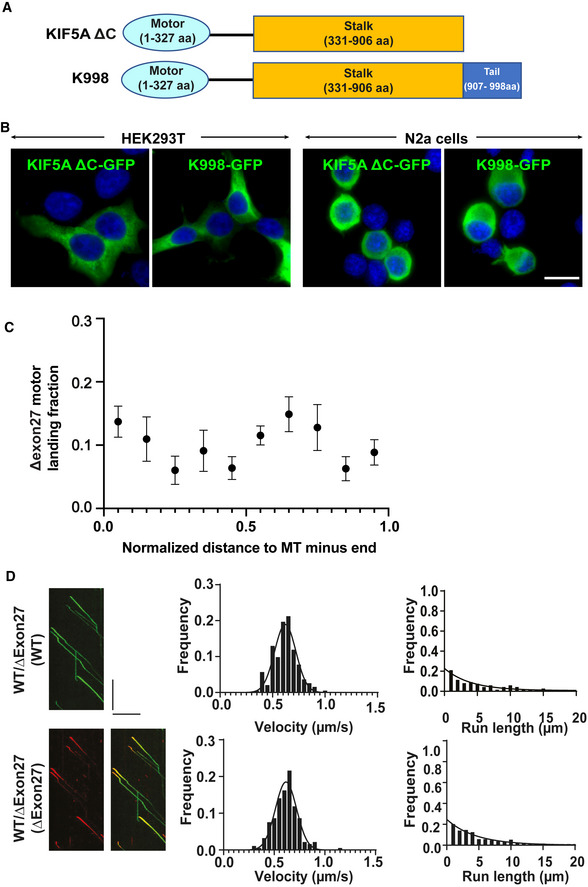
Motor velocities (middle) and run‐lengths (right) were determined based on kymographs (example on the left) for KIF5A WT and ∆Exon27 complexes. HEK293T cells were transfected with both KIF5A WT‐GFP and ∆Exon27‐mApple. The movements of WT and ∆Exon27 were assessed by tracking either GFP or mApple, respectively. The right kymograph in
D is the overlay of the GFP and mApple of moving WT‐GFP/∆Exon27‐mApple complexes. The
x‐axis scale for the processivity graphs was limited to 20 μm to permit a direct comparison of the run‐lengths of the different constructs. Diagonal lines in the kymograph represent KIF5A molecules moving over time. The velocity data were fit with Gaussian distribution and the processivity data were fit with an exponential decay function. The depicted scale bars for all kymographs shown in this figure is 5 μm (horizontal line) and 10 s (vertical line). The measured values for the velocities and run‐lengths are listed in Table
1.