
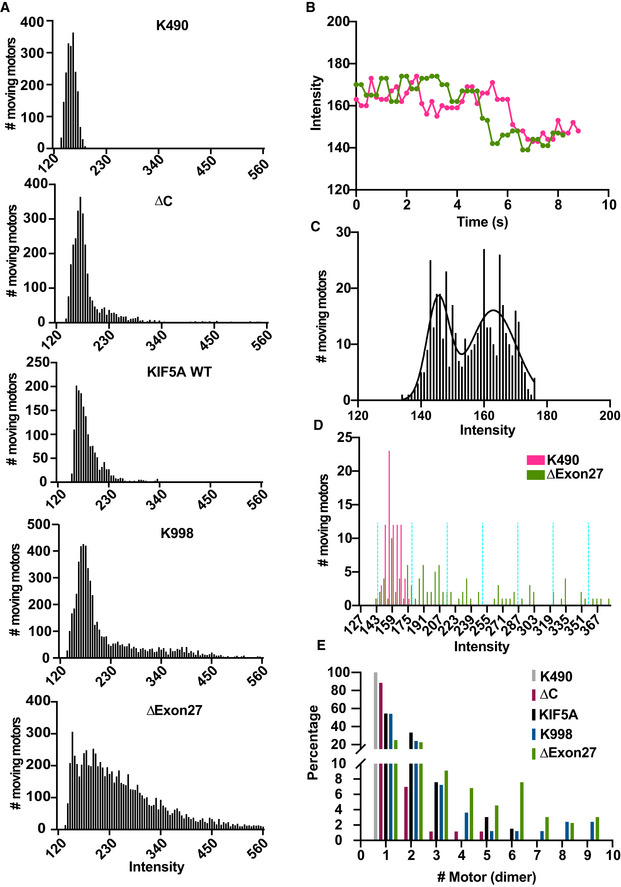
Figure EV4. Enhanced motor self‐association in KIF5A ΔExon27.
-
AHistograms of the measured fluorescence intensities of the various moving kinesin motors. The fluorescence intensity in every frame of each moving spot was measured, accumulated, and plotted in a histogram. Numerous studies have shown that truncated kinesin‐1 motors are dimeric and active (Friedman & Vale, 1999; Tomishige et al, 2006; Lam et al, 2021), and kinesin‐1 family is highly conserved in the motor domain. Hence, a truncated KIF5A motor (K490, amino acid 1–490) was generated and used as the standard for fluorescence intensity of dimeric motors. Moving KIF5A ∆Exon27 molecules exhibit a much larger fraction of motors with high fluorescence intensities. The majority of moving KIF5A ∆Exon27 spots consist of multiple motors. K490: repeated two times, n = 189; other constructs are described in Fig. 4. Number of frames that have been analyzed: K490, n = 1,953; ∆C, n = 2,964; WT, n = 1,634; K998, n = 5,462; ∆Exon27, n = 8,345.
-
BTwo example traces of K490‐EGFP showing photobleaching events. K490‐EGFP was used as the standard dimer molecule to determine the fluorescent intensity of EGFP.
-
CHistogram of measured intensities of moving K490‐EGFP molecules that showed a single photobleaching step. The intensity distribution was fit with two Gaussian functions, resulting in mean values of 145.5 ± 3.6 (mean ± SD) and 163.0 ± 7.3. With an average background fluorescence signal of 127.6 ± 0.7, one obtains an average fluorescent intensity is 17.7 for EGFP (in a.u.).
-
D, EDetermination of the percentage of the number of motors for each motor complex. KIF5A K490 and KIF5A ∆Exon27 are depicted here as examples (D). The same method was applied to the other motors. Each moving spot was assigned to a single intensity value that corresponded to the average intensity measured over the first 20 frames of the moving spot so the intensity would be less likely to be averaged down due to photobleaching. The measured values were then accumulated and plotted in a histogram. Based on the mean intensity of EGFP, the measured intensity values were sorted into intervals of 35.4 (depicted by the turquoise dashed lines), with the first interval centered at 163 (163 ± 17.7). The percentage of each bin was calculated and then assigned to the calculated number of dimers (E). The percentages of a single dimer for all KIF5A constructs are: K490, 100%; ∆C, 88%; K998, 54%; WT, 54%; ∆Exon27, 25%.